Eoforest
Earth Observation Services for Forest Management
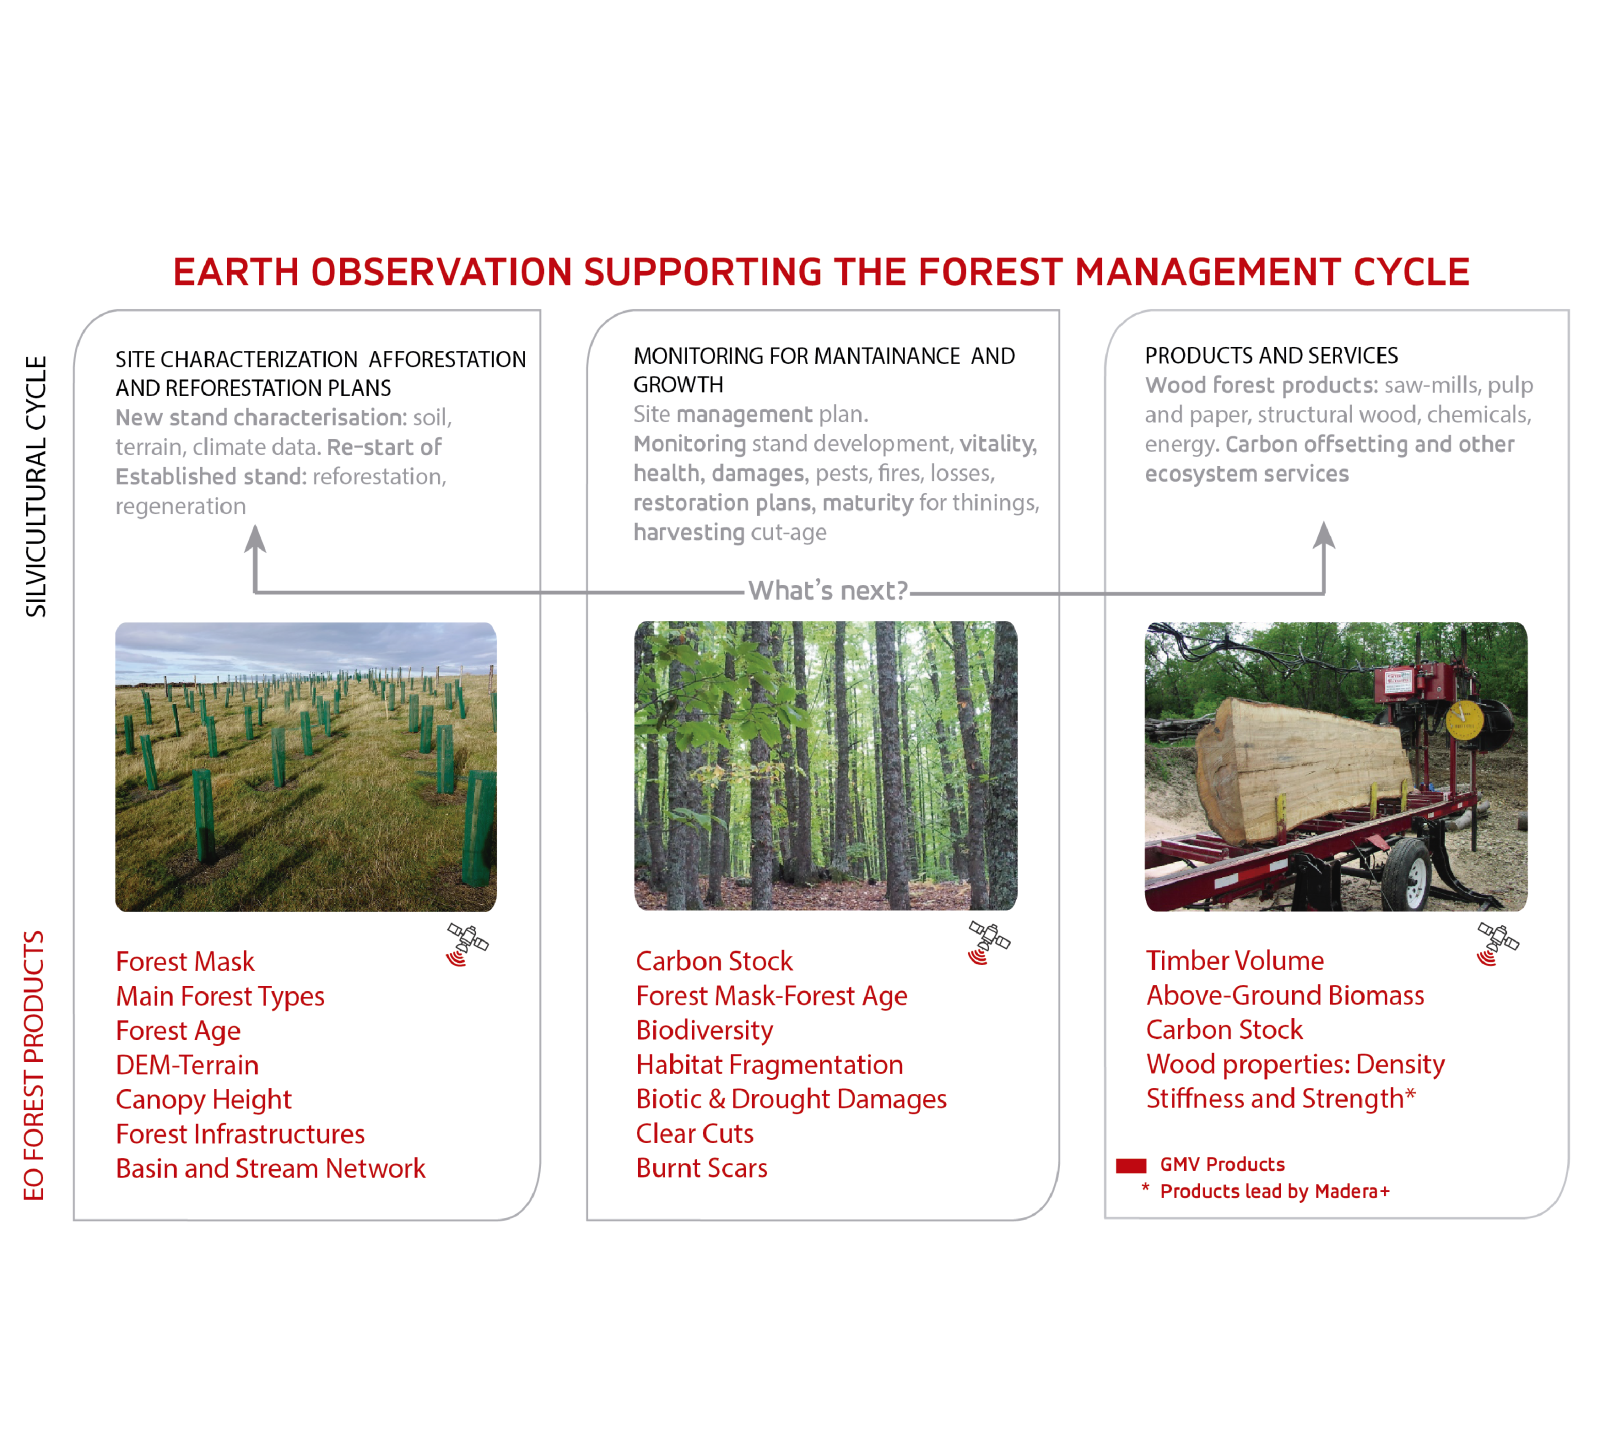
Eoforest - Earth Observation Services for Forest Management
Eoforest is GMV’s catalogue of forestry-related geoinformation products integrated into a single platform to facilitate the sustainable management of forest resources by those organizations involved:
- public sector with management and reporting commitments,
- private forest owners and associations,
- forest-based industry, and
- environmental and conservation agencies.
Eoforest meets existing geospatial data standards so, our products can be downloaded into any geo-viewer through Open Geospatial Consortium (OGC) standard services.
For any questions or requests, please contact us at [email protected]
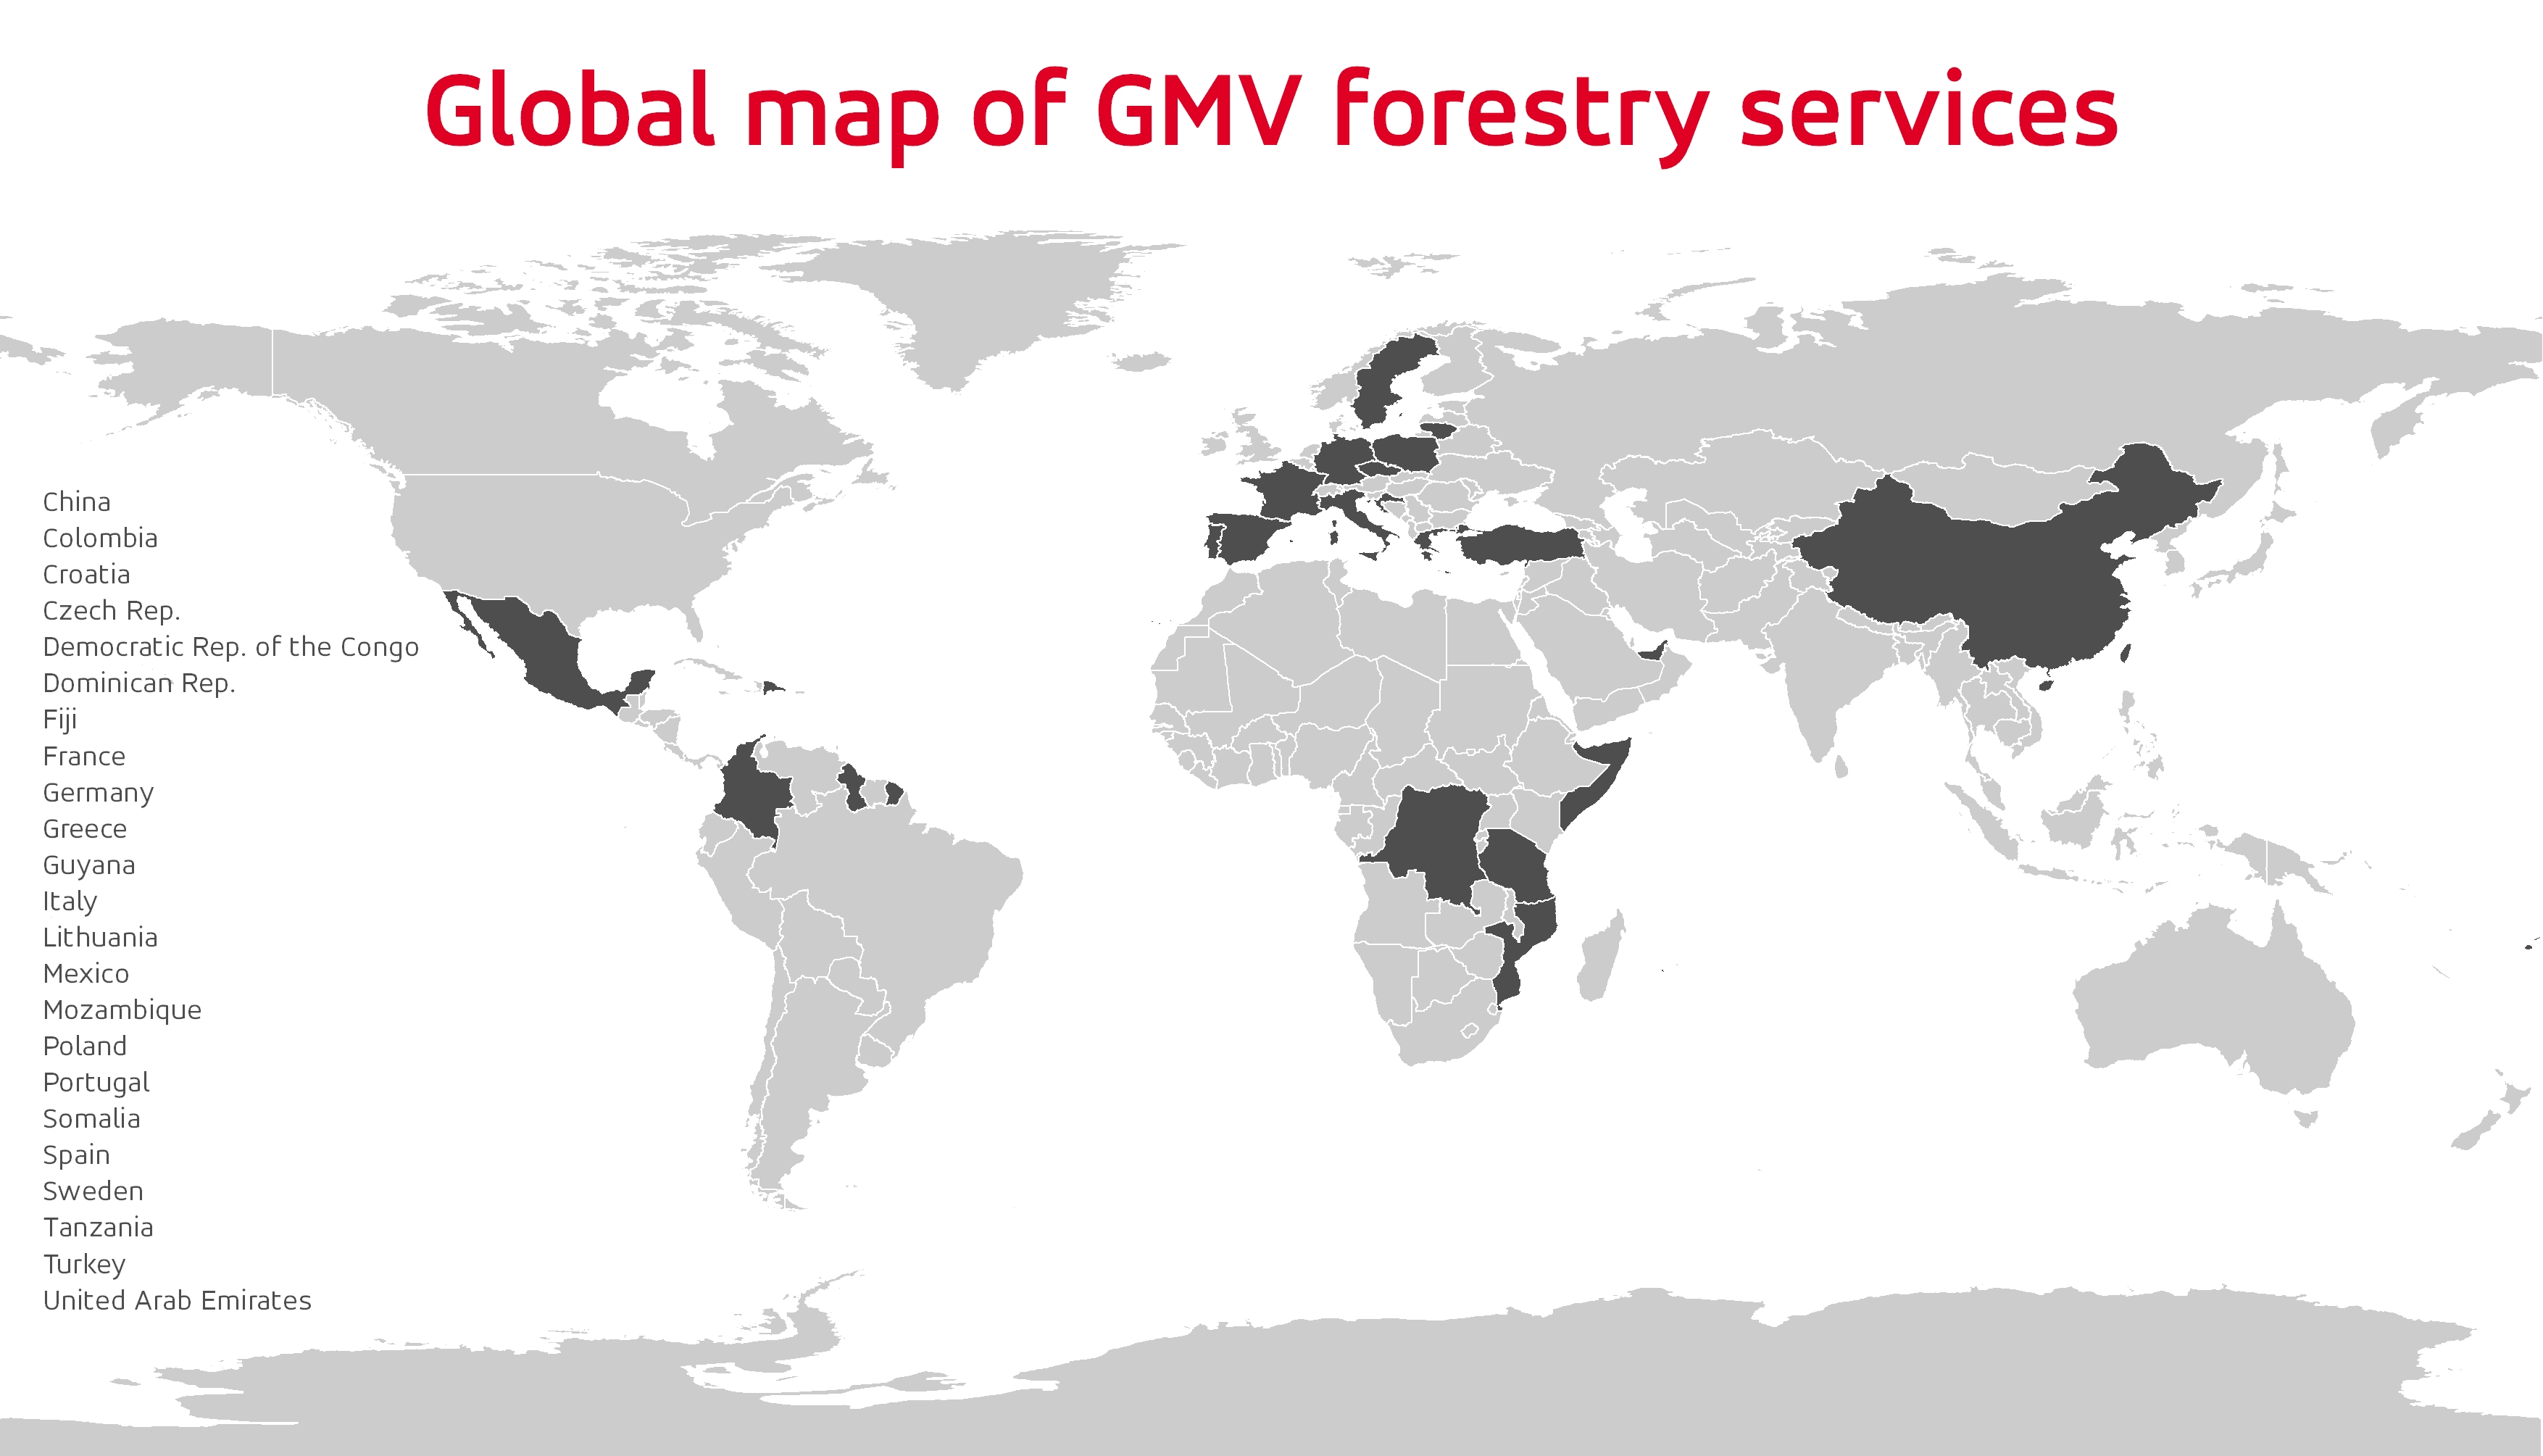
of experience in providing Earth observation forestry solutions
worldwide have implemented our solutions
Highlights
Key services:
- Site characterization afforestation and reforestation plans
- Monitoring for maintenance and growth
- Carbon offsetting
- Ecosystem Vulnerabilities

16 Earth Observation products dedicated to enhance sustainable forest management

GMV’s catalogue of forestry-related geoinformation products is integrated into a single easy to access platform
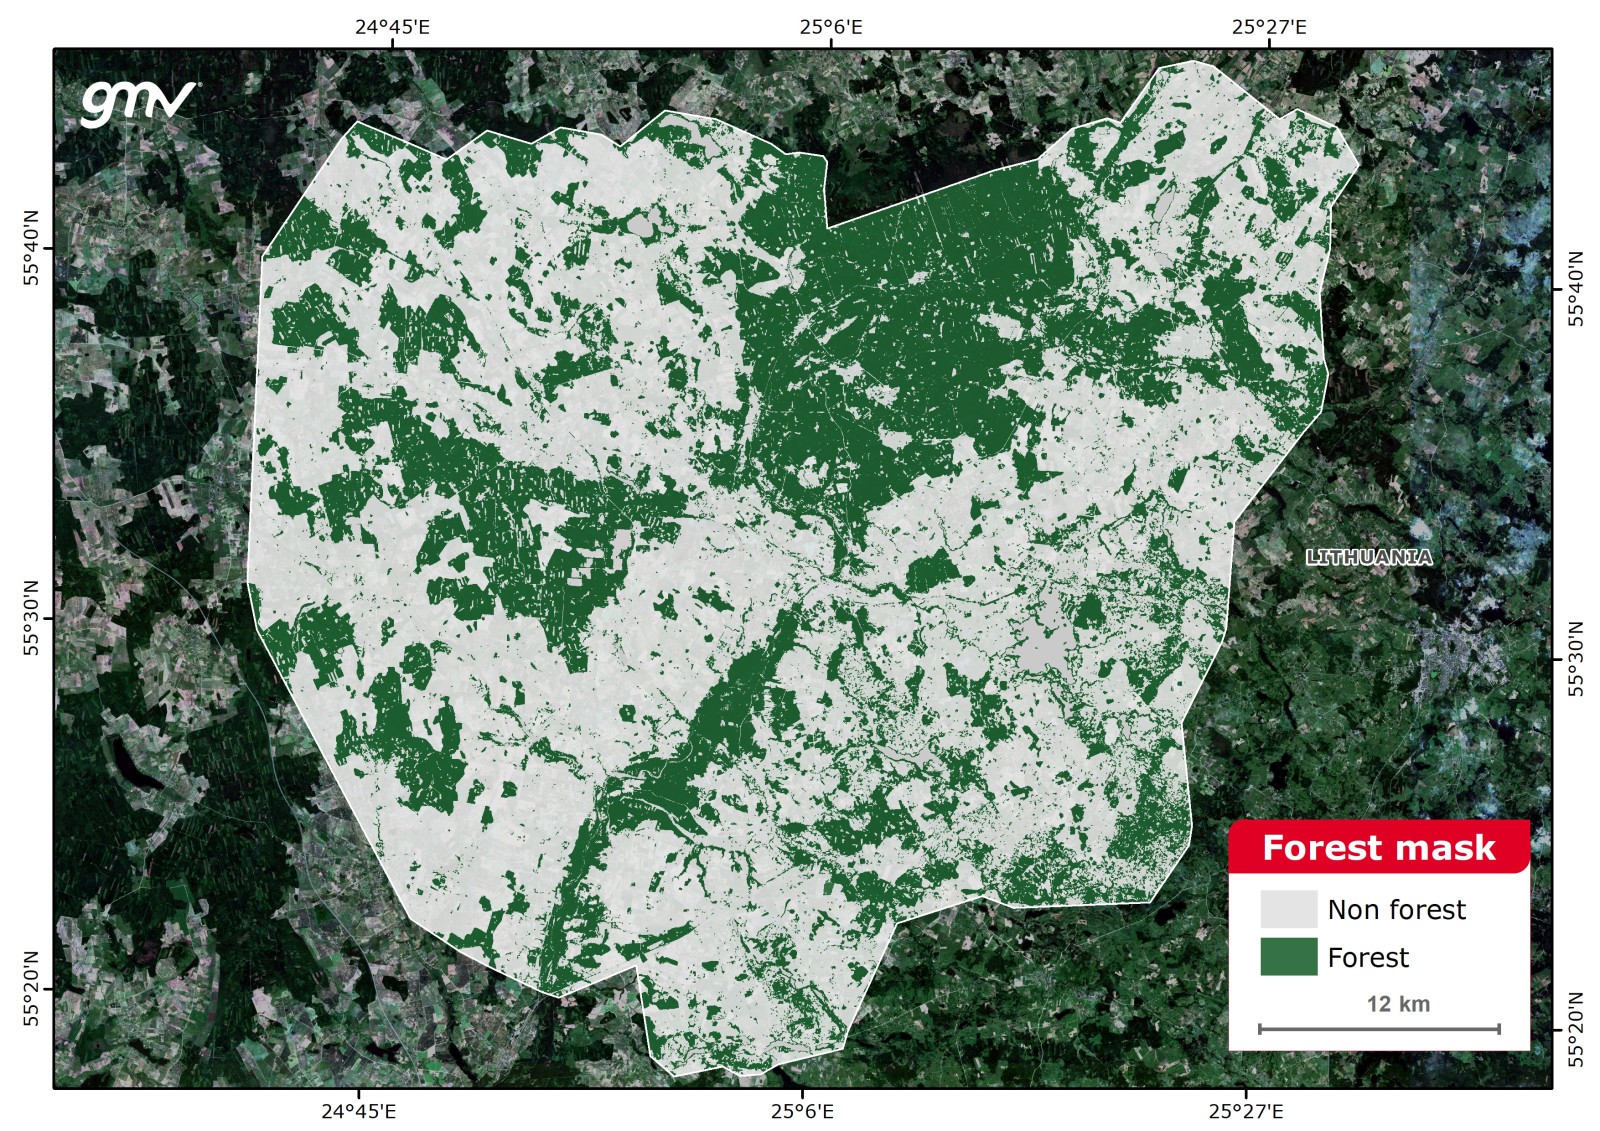
Forest Mask
The Forest Mask product provides a binary forest-non forest classification. For deciduous/mixed forest, several images are required, to account for seasonal foliage conditions. Additionally, a probability map is generated to obtain the confidence level of each pixel in the binary classification. The probability map may be used to distinguish pure forest areas from transitional or degraded ones.
The Forest Mask product is the basis for other products such as forest type classification or vegetation stress monitoring. The product adapts to the definition of forest valid in each country.
Main applications:
- Forest inventory
- Forest and natural resources management
- Land use planning and land use and land cover dynamics monitoring
- Environmental impact assessment
- Deforestation and degradation analyses
- Biomass estimation and carbon offsets projects
- Canopy cover fraction
- Biodiversity conservation
- Forest fire-fighting plans
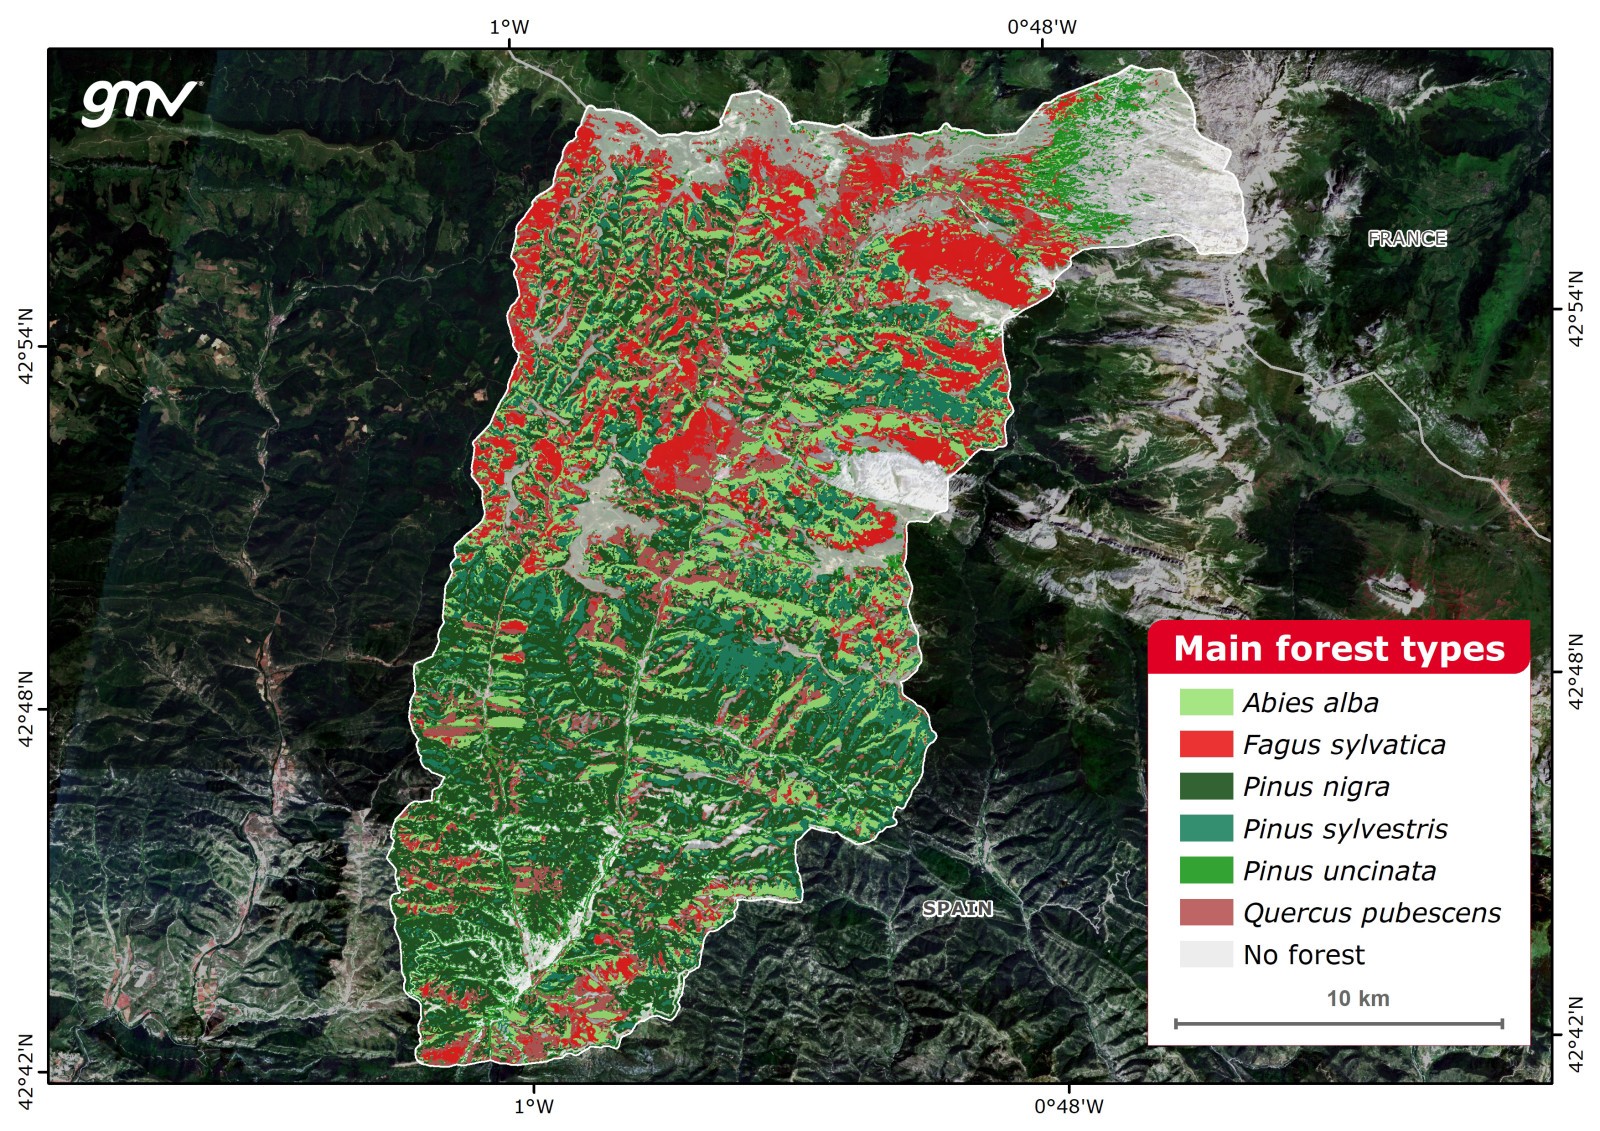
Main Forest Types
A supervised image classification which provides a map of the dominant species spatial distribution and identifies the mix of species present within an area. Additionally, a probability map is generated for each species to obtain the confidence level of each pixel in the classification. The probability maps may be used to study the dominance or coexistence of species in each pixel, as well as to approximate the uncertainty of dominant species map.
A preliminary desk study of the dominant species or forest communities is required. Species, communities or masses categories are customizable to meet user and locations needs.
Main applications:
- Forest inventory
- Forest and natural resources management
- Land use planning and land use and land cover dynamics monitoring
- Environmental impact assessment
- Biomass estimation and carbon offset projects
- Biodiversity conservation
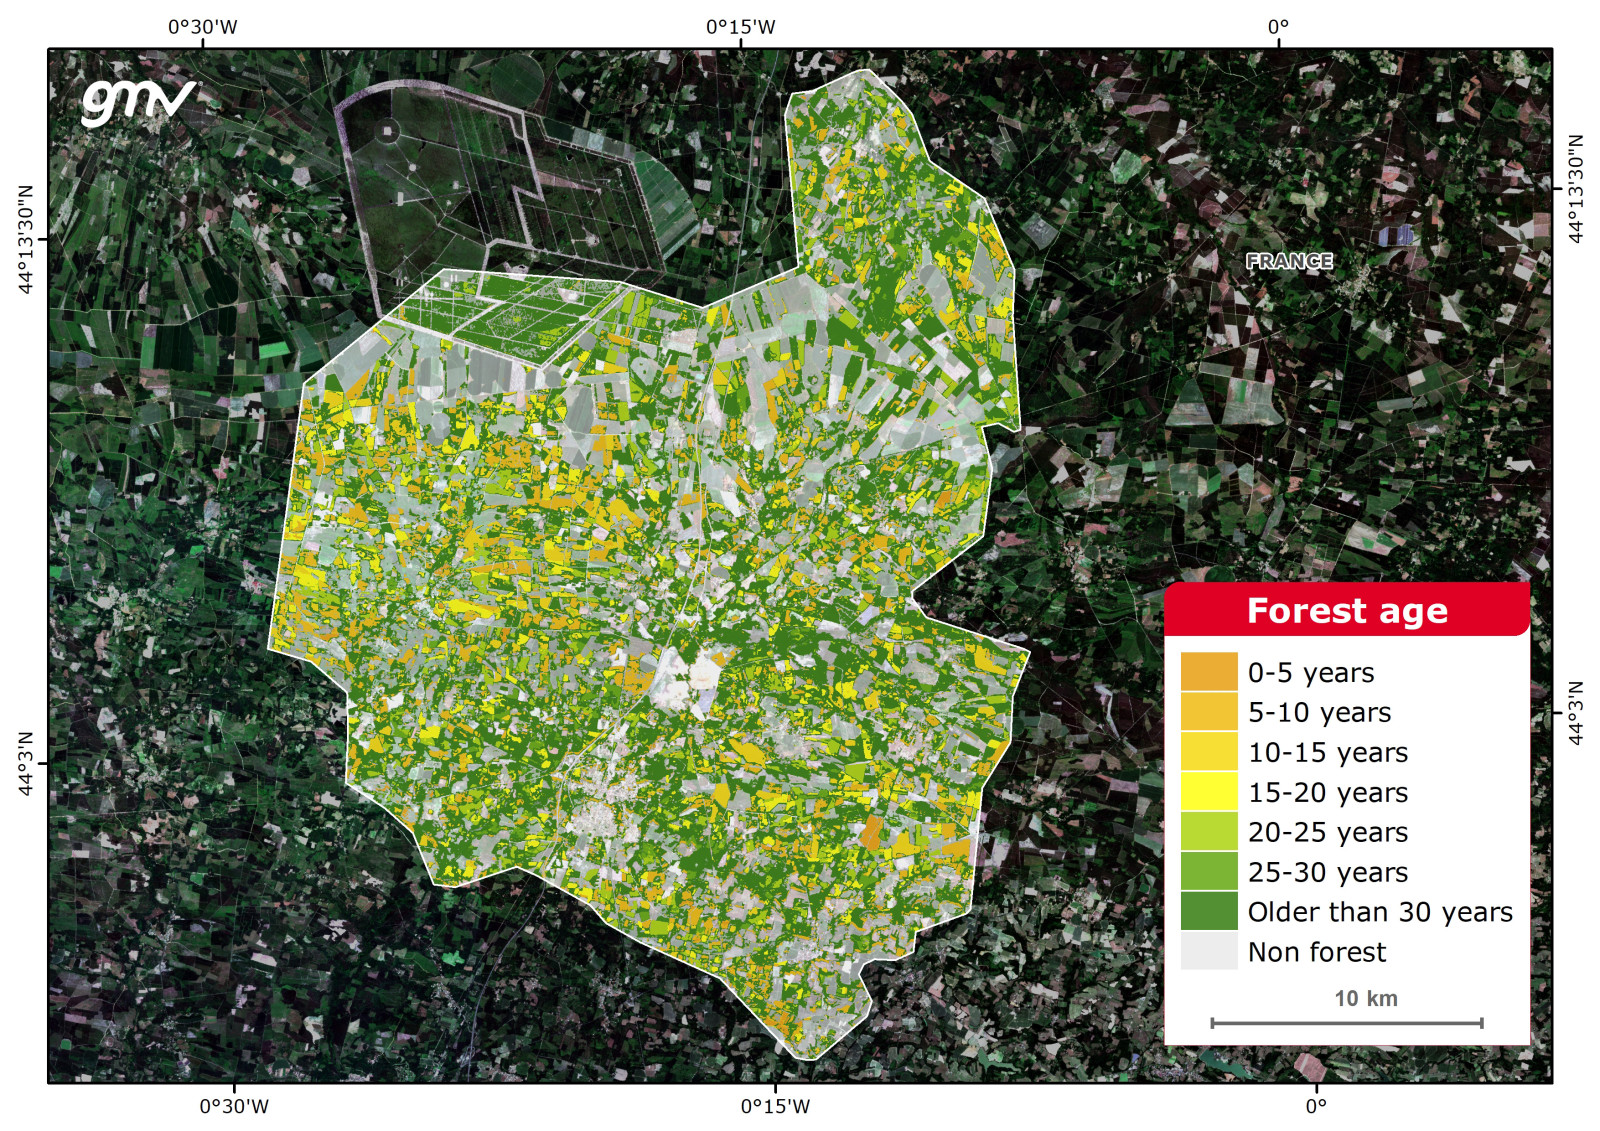
Forest Age
The Forest Age product is obtained by analyzing multitemporal satellite data derived from Landsat (1984-2015) and Sentinel-2 (from 2016 onwards) missions. Due to the length of data record, the product cannot distinguish age ranges beyond 30 years and a unique category is assigned, which is labelled “older than 30 years”.
Main applications:
- Forest inventory
- Forest and natural resources management
- Land use planning and land use and land cover dynamics monitoring
- Environmental assessment
- Biomass estimation and carbon offset projects
- Biodiversity conservation
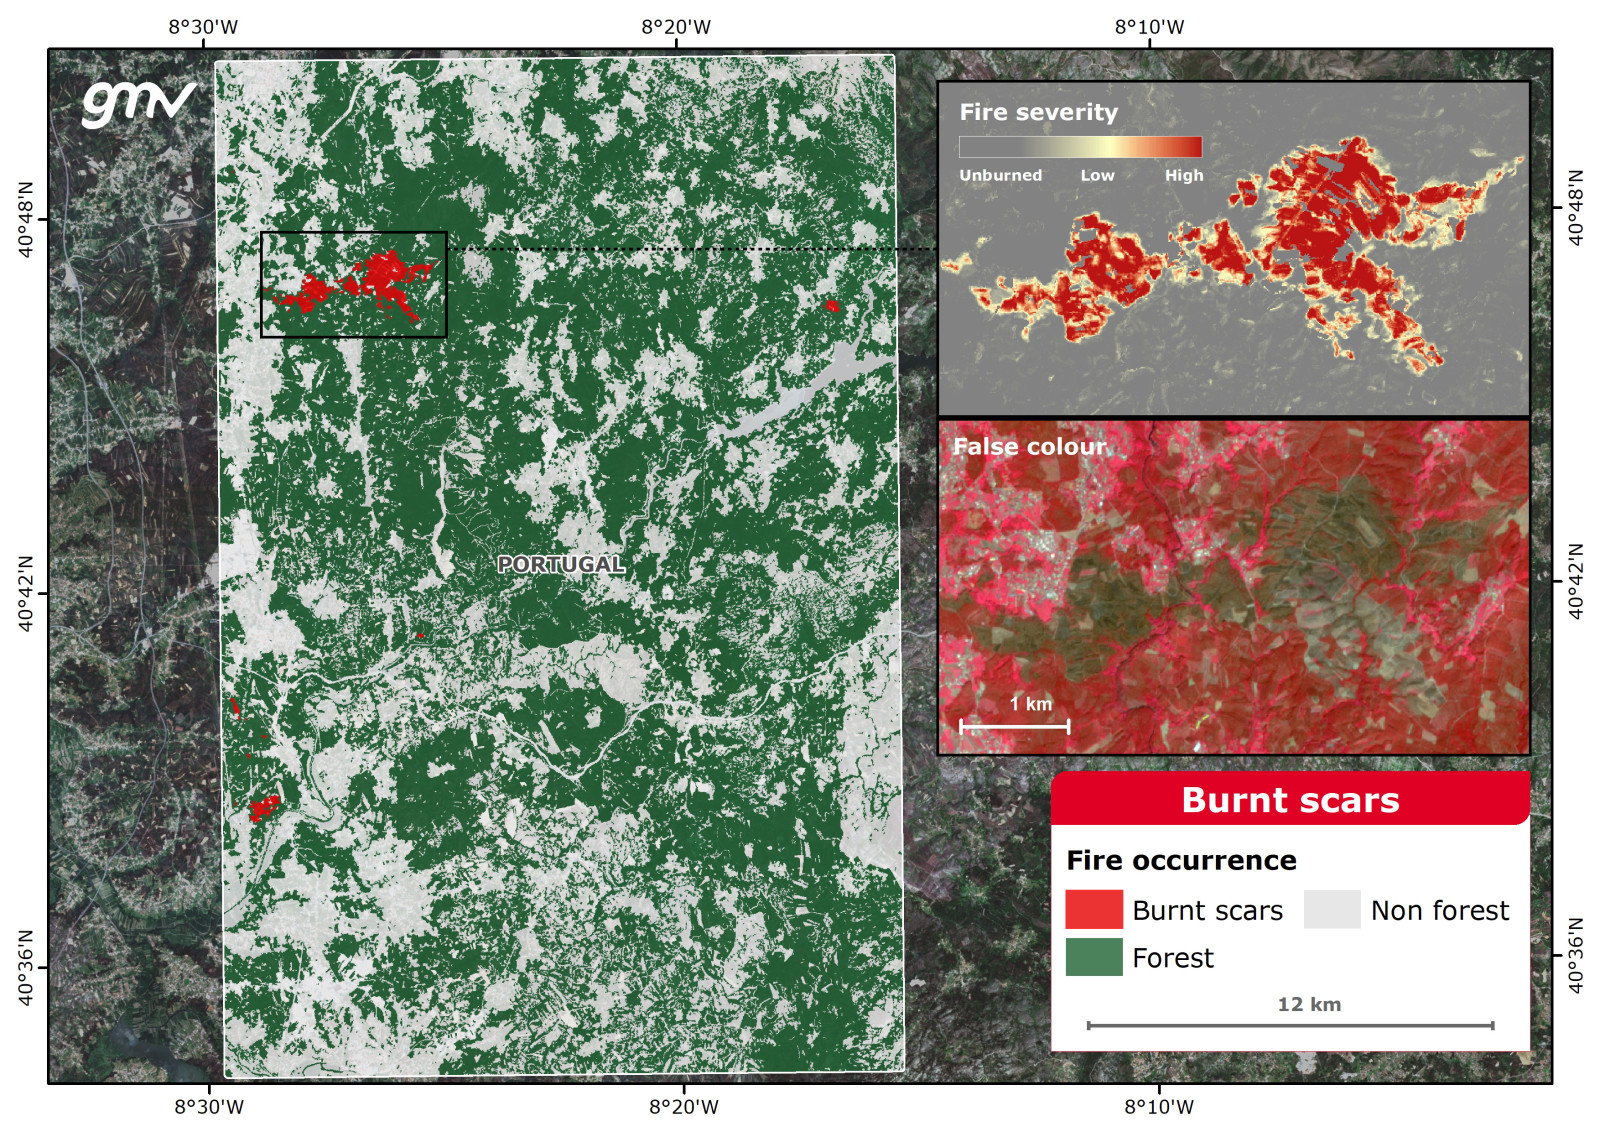
Burnt Scars
Burnt forest areas are mapped out using change detection techniques between two dates (pre-fire/post-fire). The analysis allows estimating the area affected by fire to support recovery plans.
Additionally, a probability map is generated to obtain the confidence level of each pixel in the binary burnt-no burnt forest classification. The probability map may be used to estimate fire severity or identify areas with high uncertainty.
Main applications:
- Forest fire damage assessment
- Regional forest fire prevention action plans
- Environmental assessment
- Reforestation plan
- Forest and natural resources sustainable management
Clear Cuts
Detection of logged forest stands between two given dates or a series of dates. Additionally, a probability map is generated to obtain the confidence level of each pixel in the binary cut-forest classification. The probability map may be used to identify areas with some uncertainty.
Main applications:
- Deforestation assessment
- Forest management - reforestation plans
- Land use land cover dynamics
- Environmental assessment
- Carbon offset projects
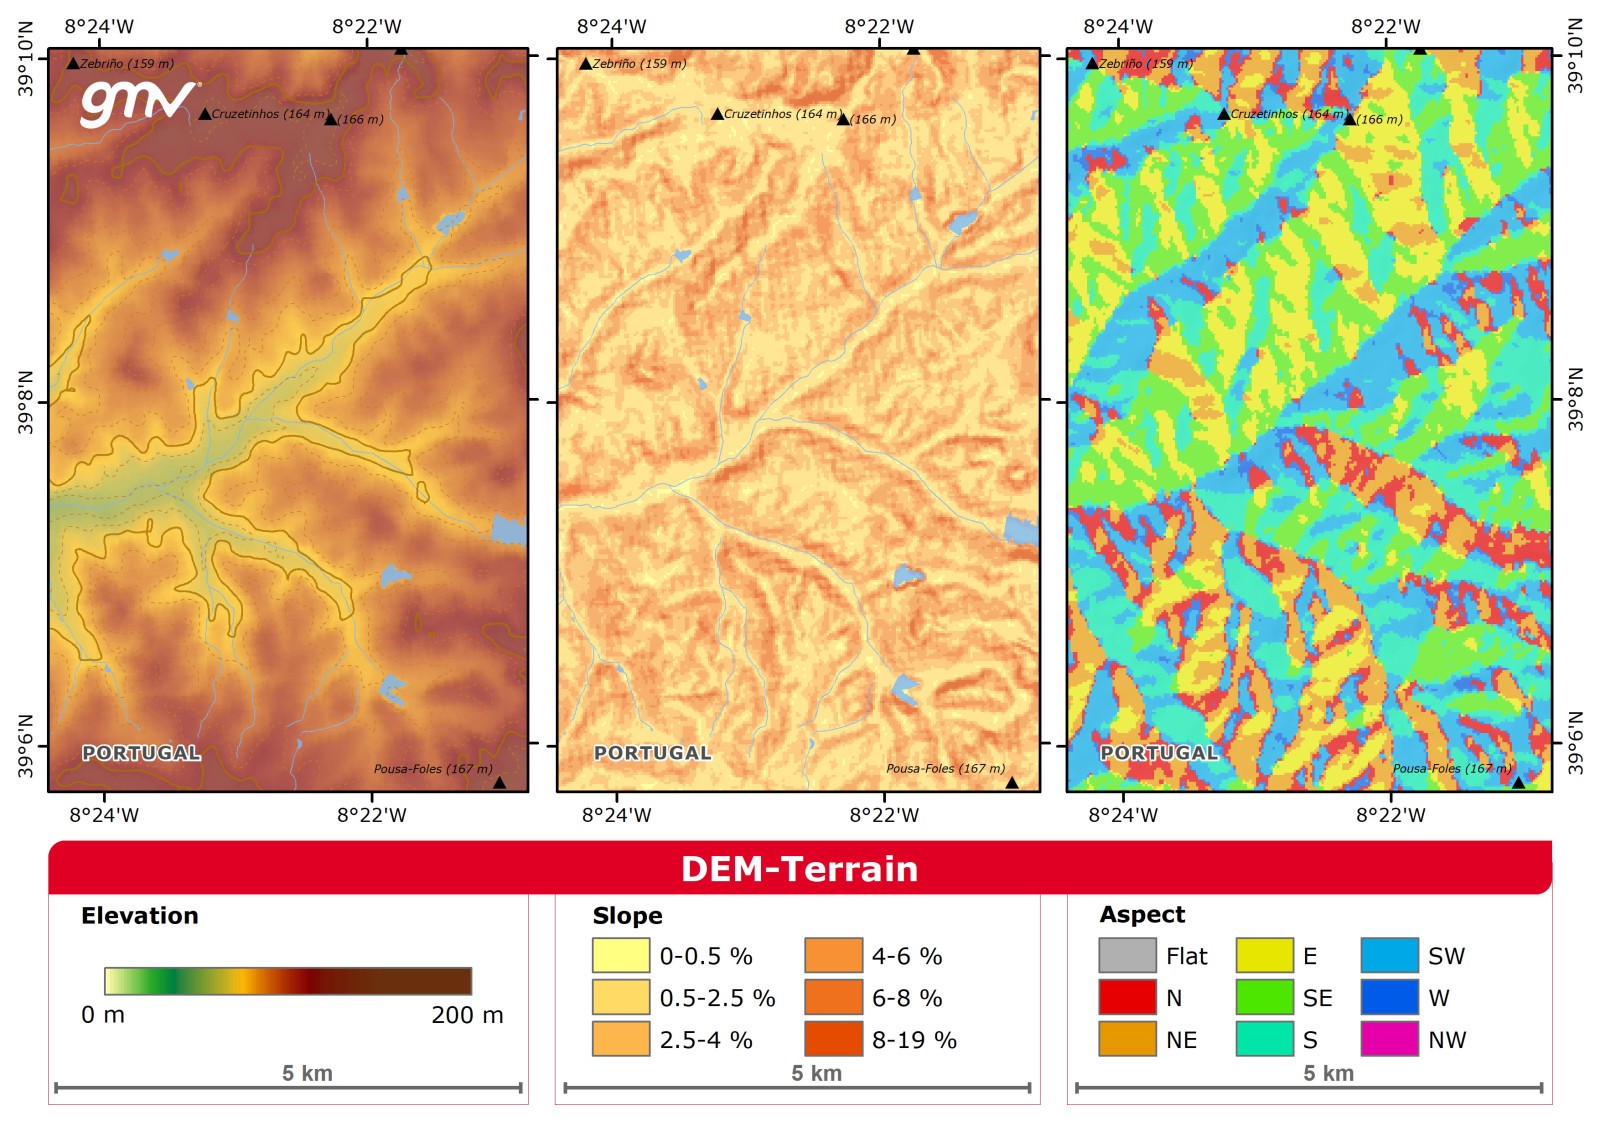
DEM-Terrain
Digital Elevation Model (DEM) products extract terrain parameters for relief maps: elevation, slope and aspect.
The product makes use of a:
- Digital surface model (DSM): represents the Earth's surface and includes all objects on it, and
- Digital terrain model (DTM): represents the bare ground surface without any objects like plants and buildings.
- Input data spatial resolution is a key element that will impact the representation of the ground.
Main applications:
- Topography
- Forest inventory, forest management
- Basin management plan
- Environmental assessment
- Hydrological modelling
- Land planning
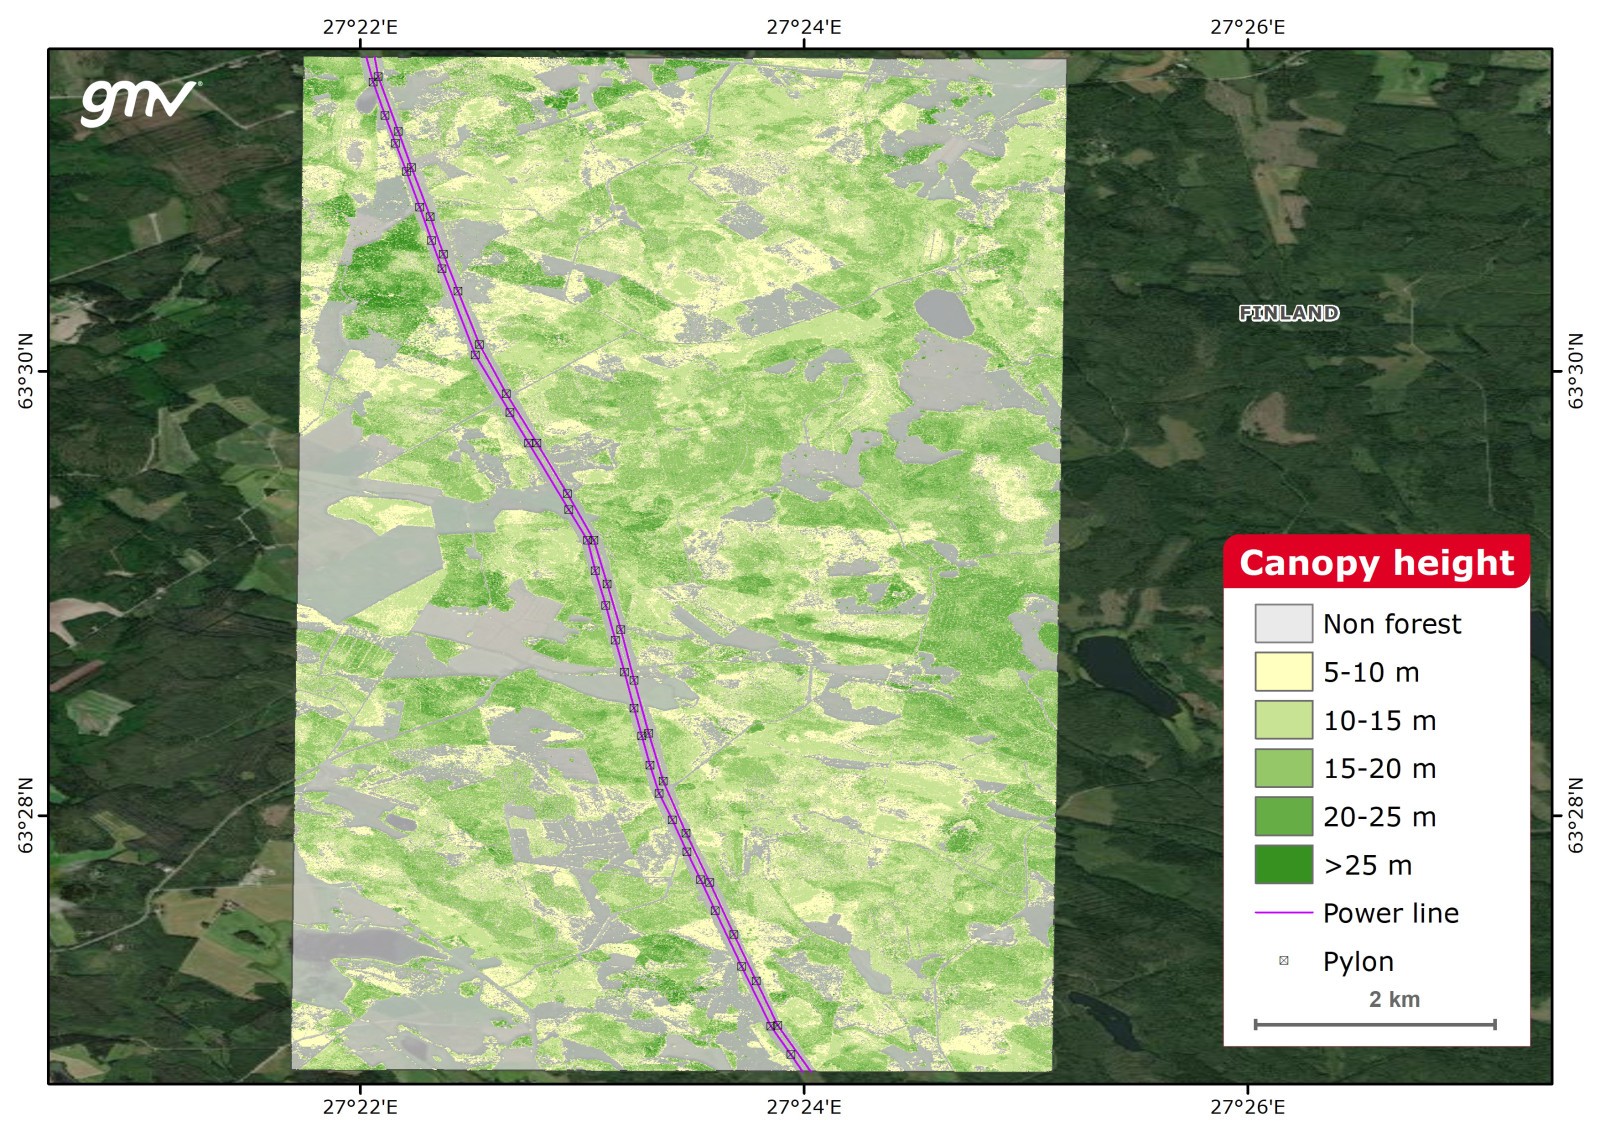
Canopy Height
The Canopy Height Model (CHM) product is derived by learning the mapping between Very High Resolution (VHR) imagery and information from a LiDAR CHM. Additionally, the mean height can be calculated per stand if the stand delineation is provided by the user or available by third party.
Main applications:
- Forest inventory
- Forest and natural resources management
- Environmental assessment
- Indirect measurements of aboveground biomass (AGB)
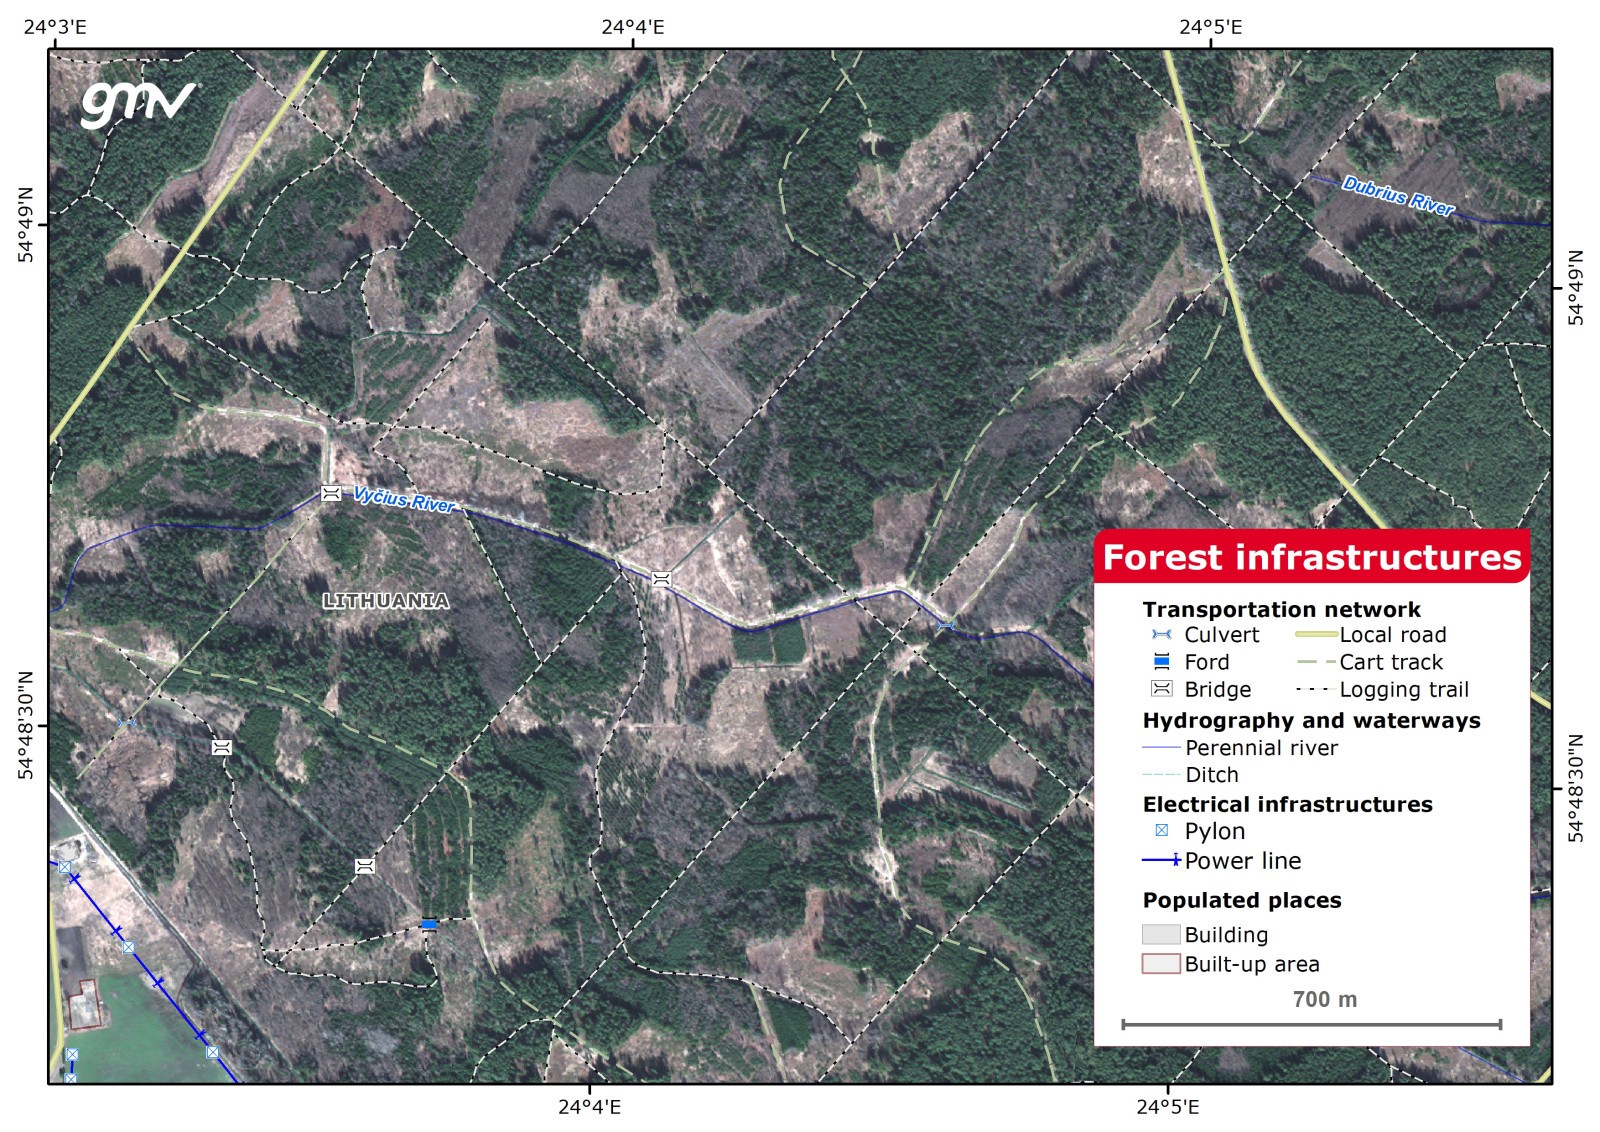
Forest Infrastructures
Geo-database of forest infrastructures, adapted from the international cartographic standard Multi-National Geospatial Co-Production (MGCP). Working scale, 1:5,000. Thematic classes of features: transportation networks, hydrology, populated places, industry, energy and LULC. Features are attributed with descriptive data for consultation. INSPIRE standards apply.
Main applications:
- Infrastructures access and maintenance
- Forest inventory and management plan
- Land use land cover dynamics
- Environmental assessment
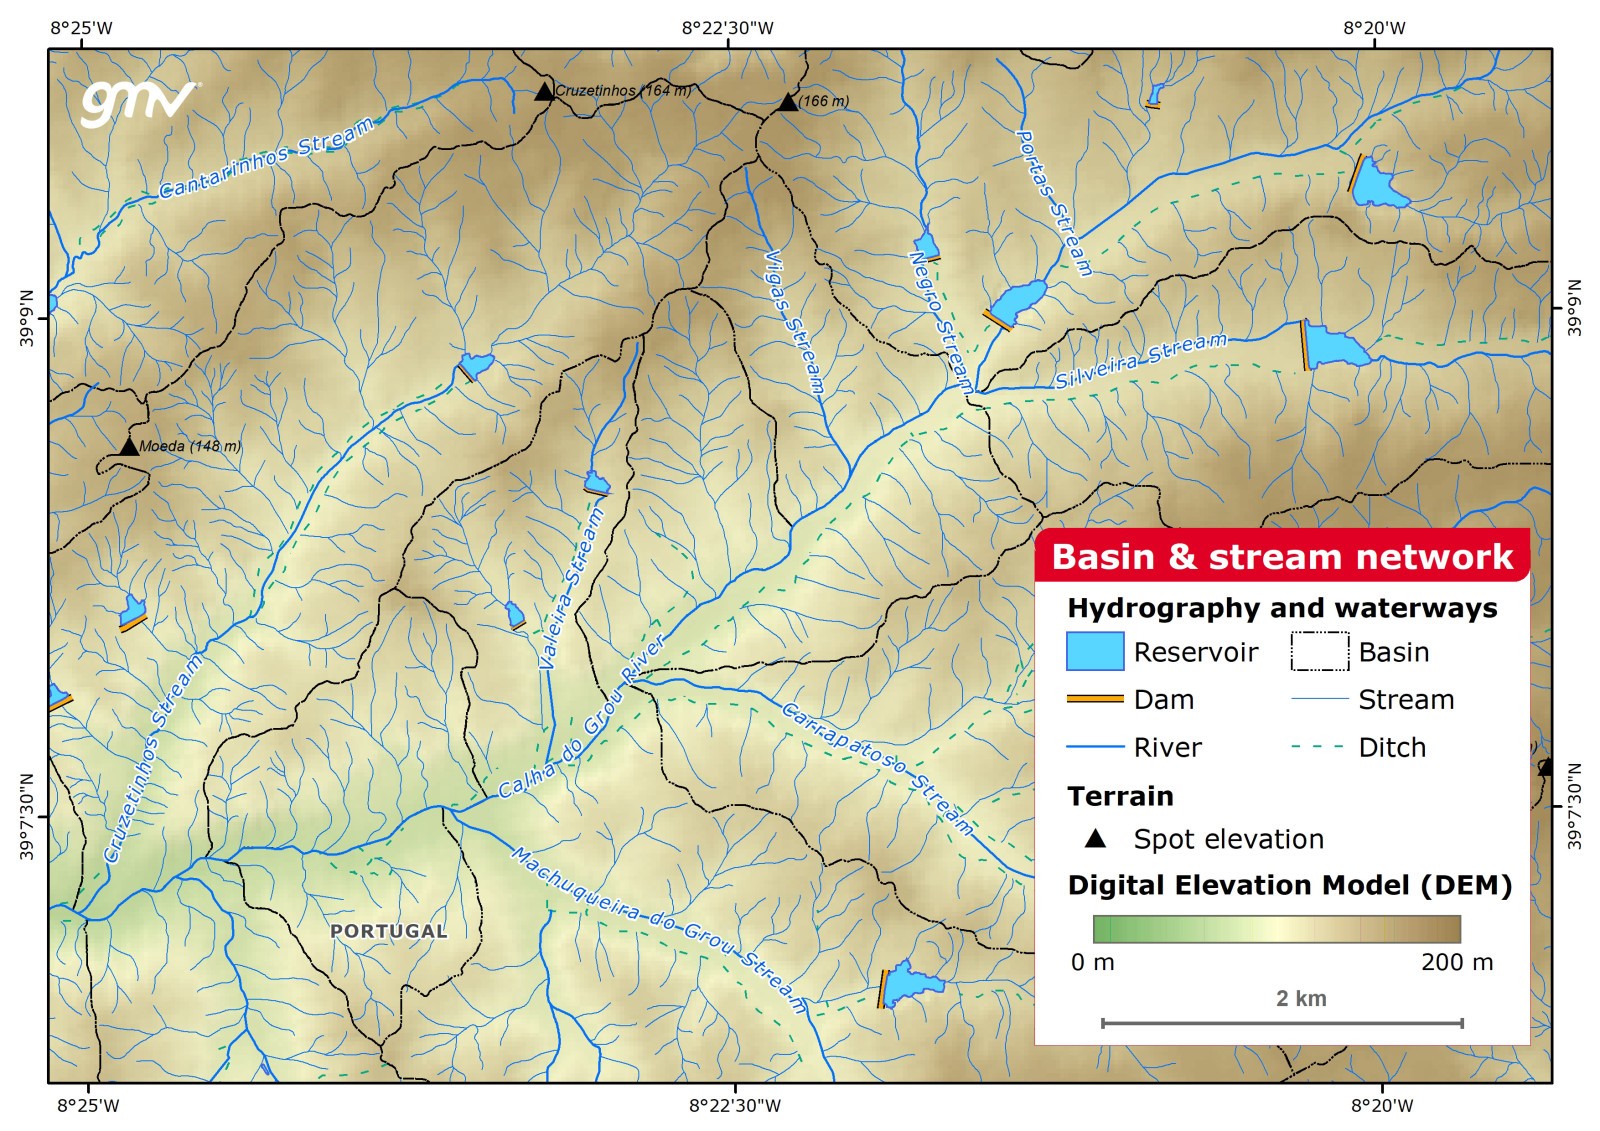
Basin and Stream Network
A geo-database of the hydrographic network, adapted from the international cartographic standard Multi-National Geospatial Co-Production (MGCP). Working scale, 1:5,000. Features: rivers, streams and water bodies. Basin delineated with DEM, watershed hierarchy included. Features are attributed with descriptive data for consultation. INSPIRE standards apply.
Main applications:
- Flood risk and erosion (soils and riverbeds)
- Water resources and forest restoration
- Environmental assessment
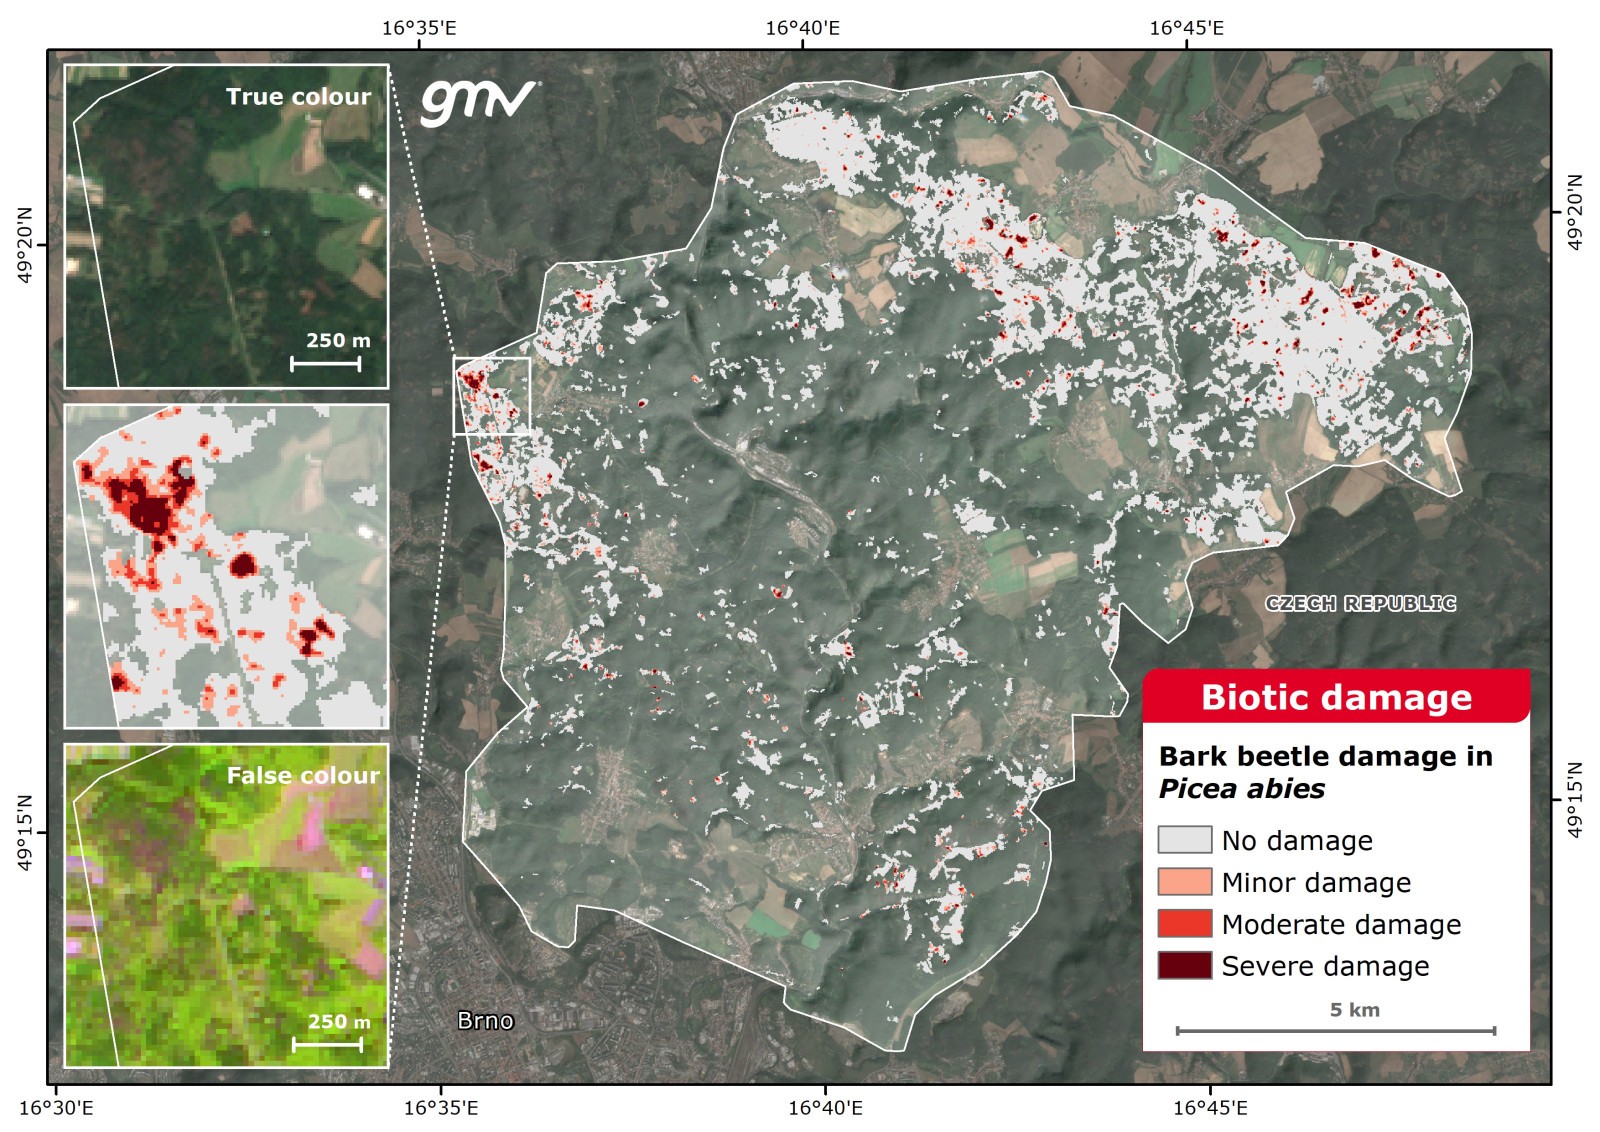
Biotic Damage
This product detects the occurrence of pest outbreaks and diseases, estimating the affected area and eventually updating the Forest Mask.
The damaged area is classified into three categories depending on the variation of forest vitality (Leaf Area Index, photosynthetic activity, and vegetation moisture).
Main applications:
- Near-real time pest and diseases damage assessment
- Environmental impact assessment
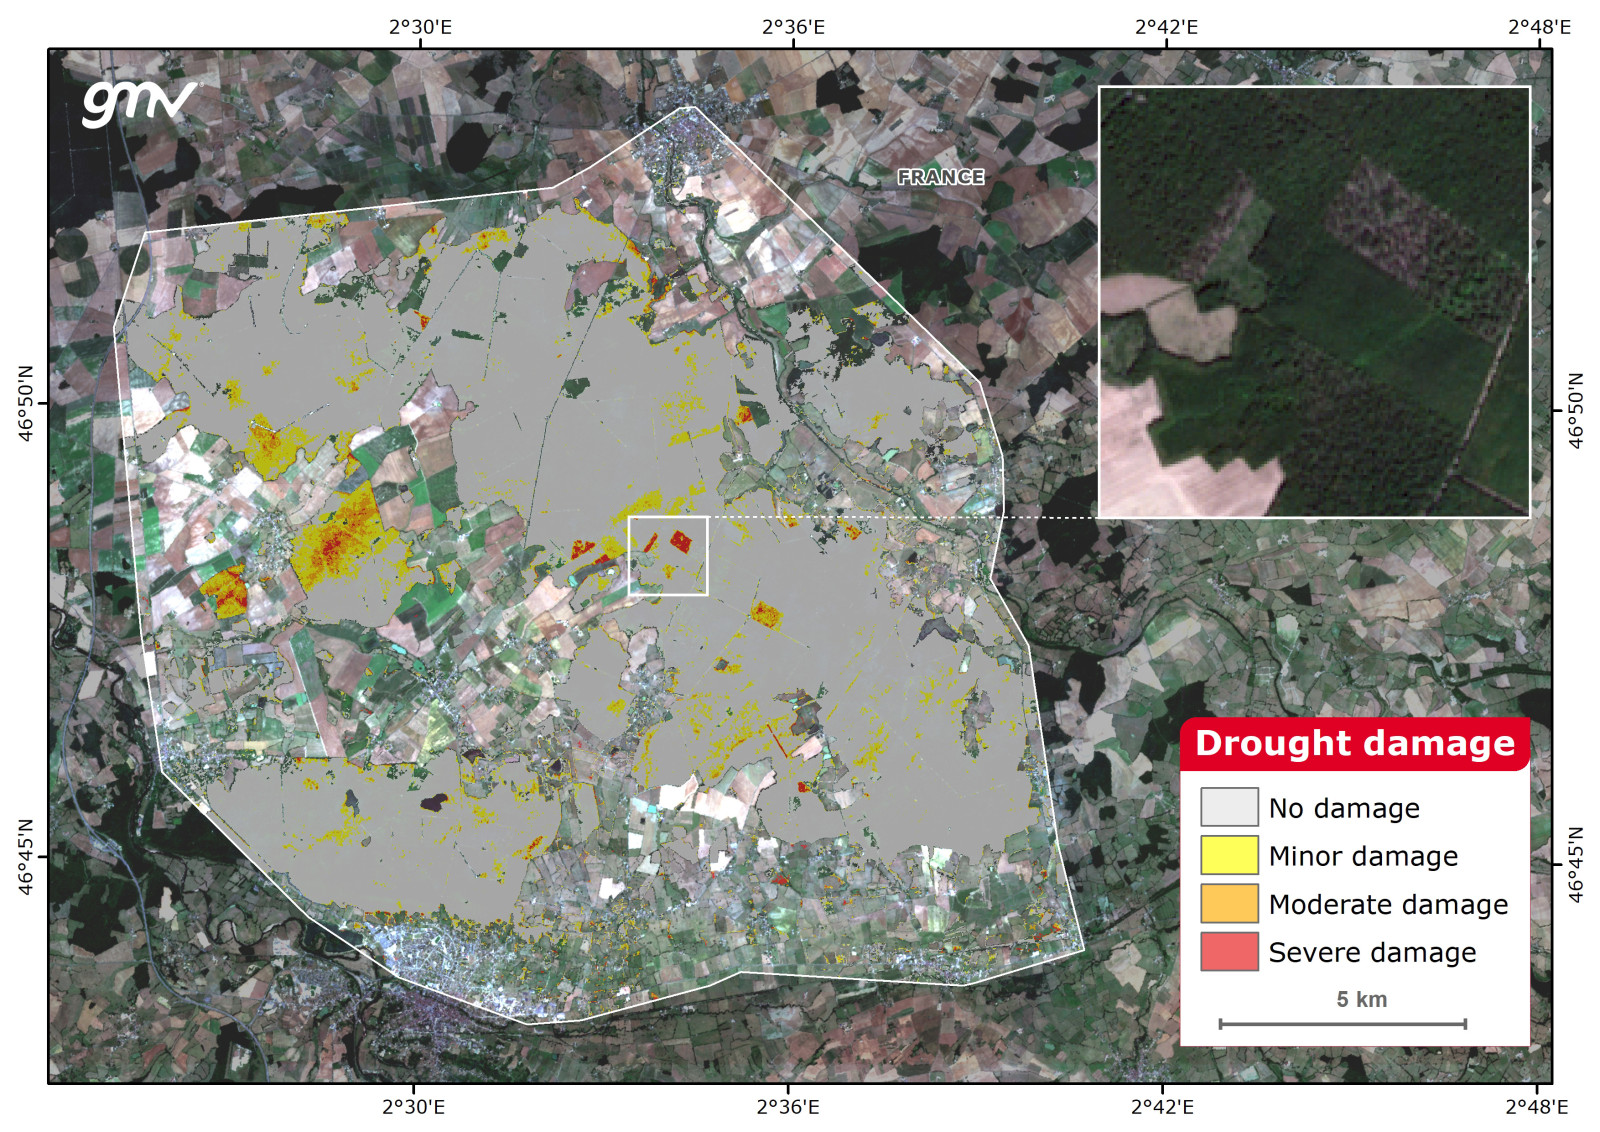
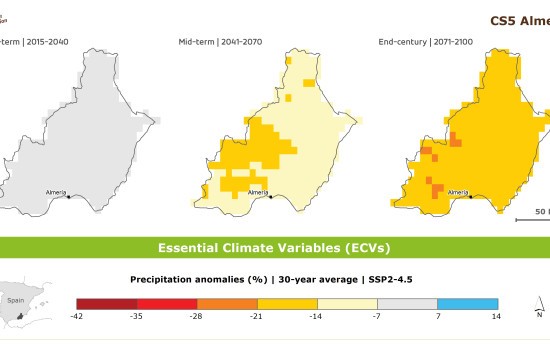
Drought Damage
This product estimates the affected drought area of the forest. Multitemporal vegetation indices and climate data are combined with Machine Learning algorithms to correlate forest health decay with drought periods. The output provides a map showing the damaged areas caused during the drought episode. The damaged area is classified into three categories depending on the variation of forest vitality (Leaf Area Index, photosynthetic activity, and vegetation moisture).
Main applications:
- Drought monitoring
- Climate change monitoring
- Environmental impact assessment
- Water resources management
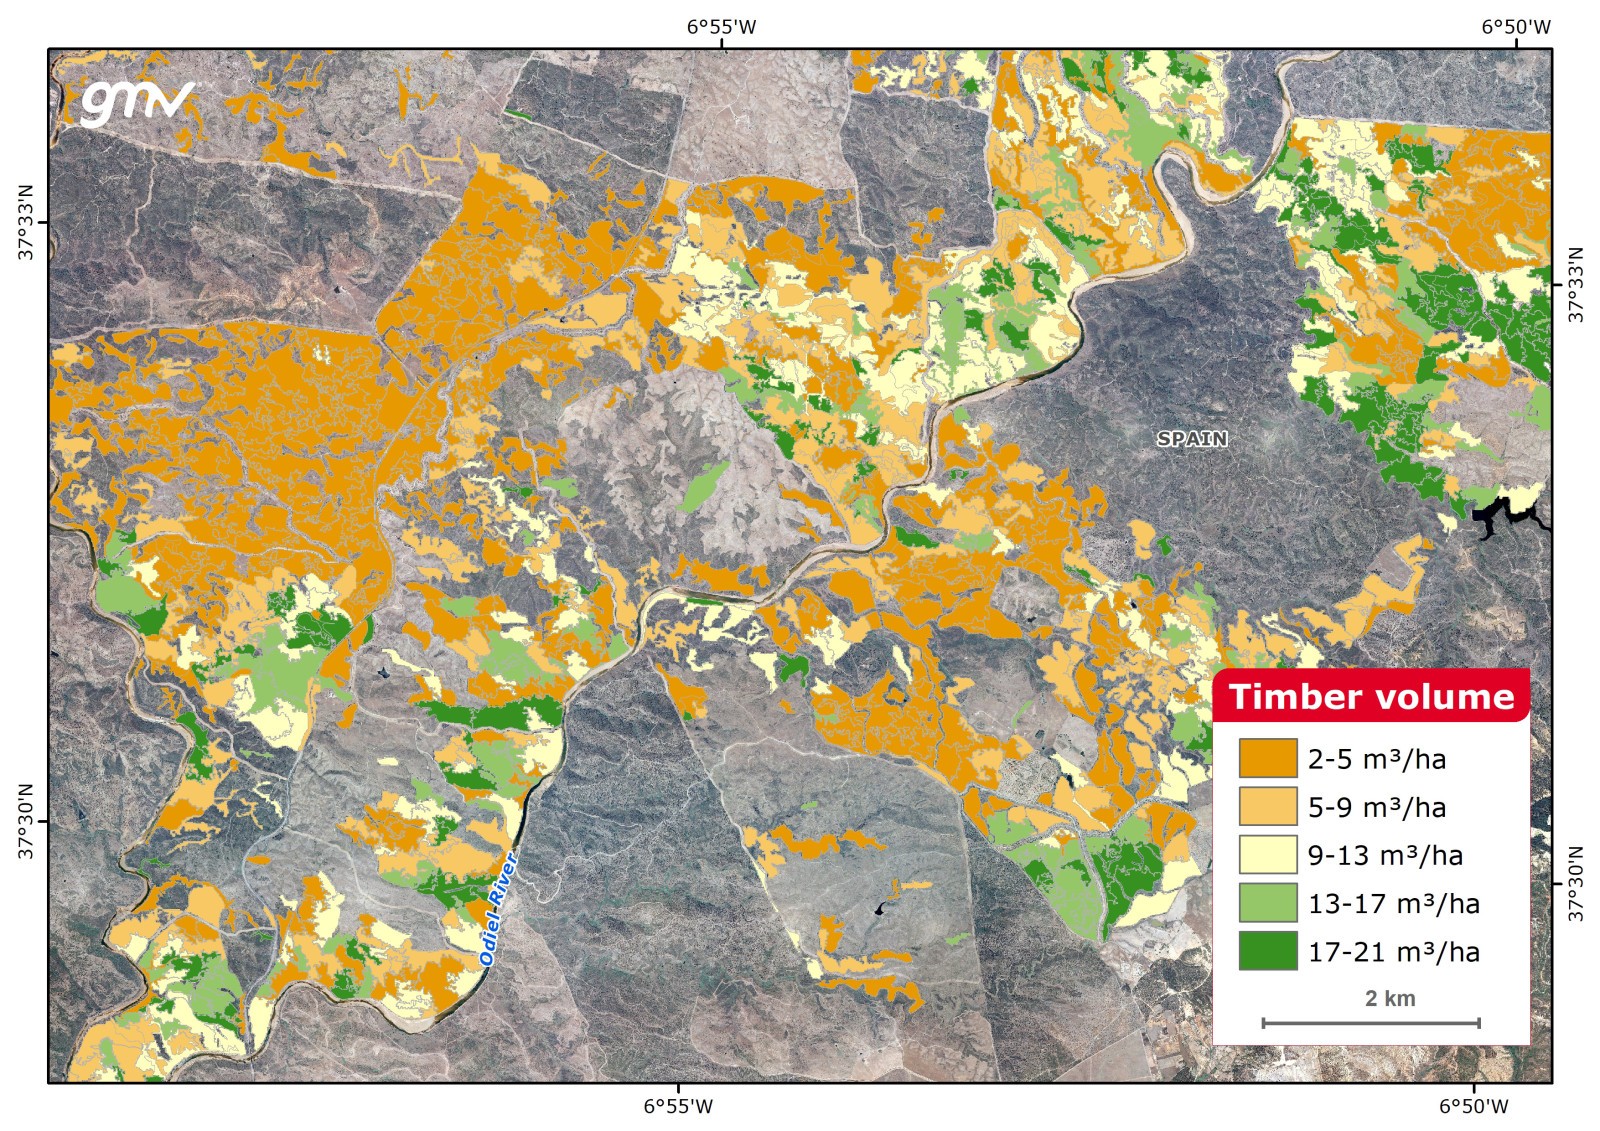
Timber volume
Timber Volume is calculated by means of the tree diameter at breast height (DBH) and the canopy height. These field data is to be correlated with SAR and optical satellite imagery using Artificial Intelligence (AI).
Satellite imagery can also be directly correlated with timber volume field data if available. Currently in development as new datasets are increasingly becoming available.
Main applications:
- Biomass estimation and carbon offset projects
- Sustainable forest management and exploitation
- Forest inventory and national forest statistics

Biomass
Aboveground biomass (AGB) consists of all woody biomass, including stems and branches, in tons per hectare. AGB is typically calculated using allometric equations based on tree diameter at breast height (DBH) and canopy height. Synthetic Aperture Radar (SAR) backscatter measurements are sensitive to forest aboveground biomass (AGB), and the observations from space can be used for mapping AGB globally. Field data is to be correlated with SAR and optical satellite imagery using Artificial Intelligence (AI) to obtain AGB estimates.
Main applications:
- Sustainable forest management
- Forest degradation and enhancement of forest carbon stocks analyses
- REDD+ activities
- Carbon offset projects
- Conservation, biodiversity programmes
- National forest statistics
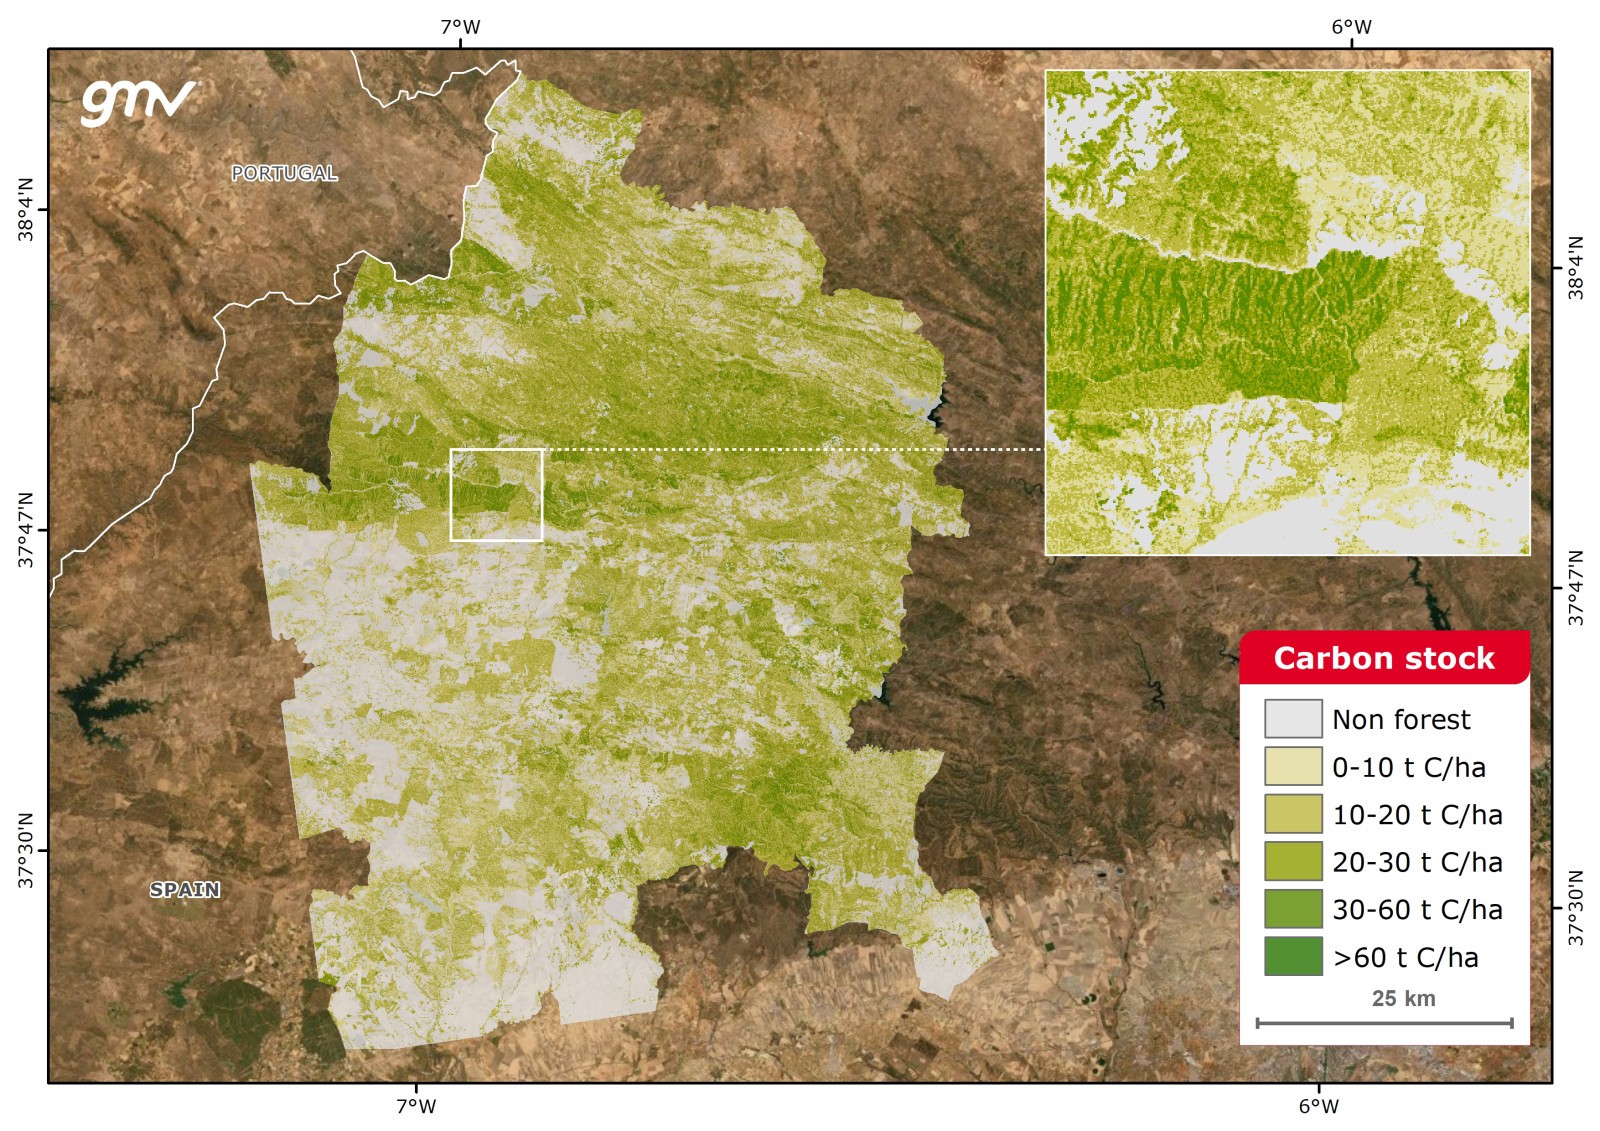
Carbon Stock
Carbon stock represents the amount of carbon that has been sequestered from the atmosphere and is now stored within the Aboveground Biomass (AGB) (t C/ha). Carbon Stock is estimated from AGB models and the carbon fraction of dry matter values published by the Intergovernmental Panel on Climate Change (IPCC).
Main applications:
- Calculation of emission factors and CO2 emissions into the atmosphere
- Monitoring reports of reduction programmes and projects
- National greenhouse gases inventories (GHG) (United Nations Framework Convention on Climate Change (UNFCCC) required reports: National communications and biennial updated reports, nationally determined contributions (NDCs), etc.)
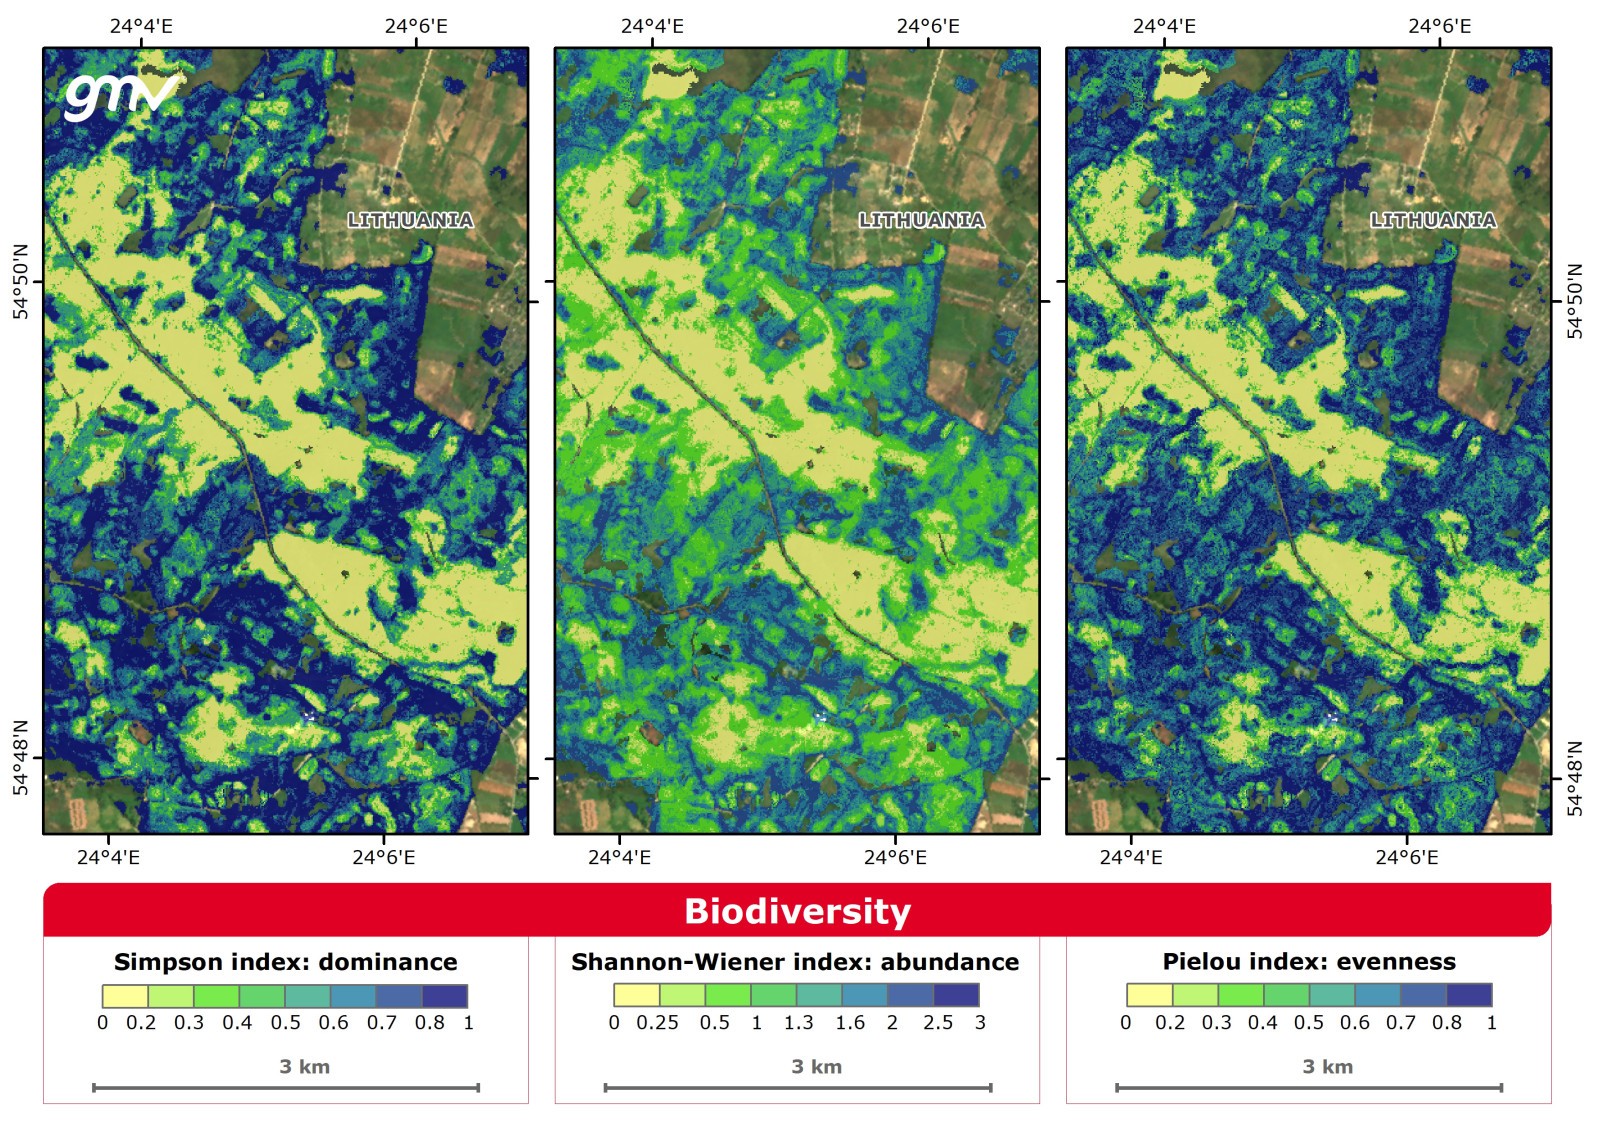
The Biodiversity product represents the intrinsic diversity of forest community calculated using indices concerning dominance, abundance, and uniformity of forest tree species. Biodiversity assessments are needed to provide information necessary to support biodiversity-related decision-making in forest policy and management.
Main applications:
- Landscape ecology
- Ecosystem restoration
- Environmental impact assessment
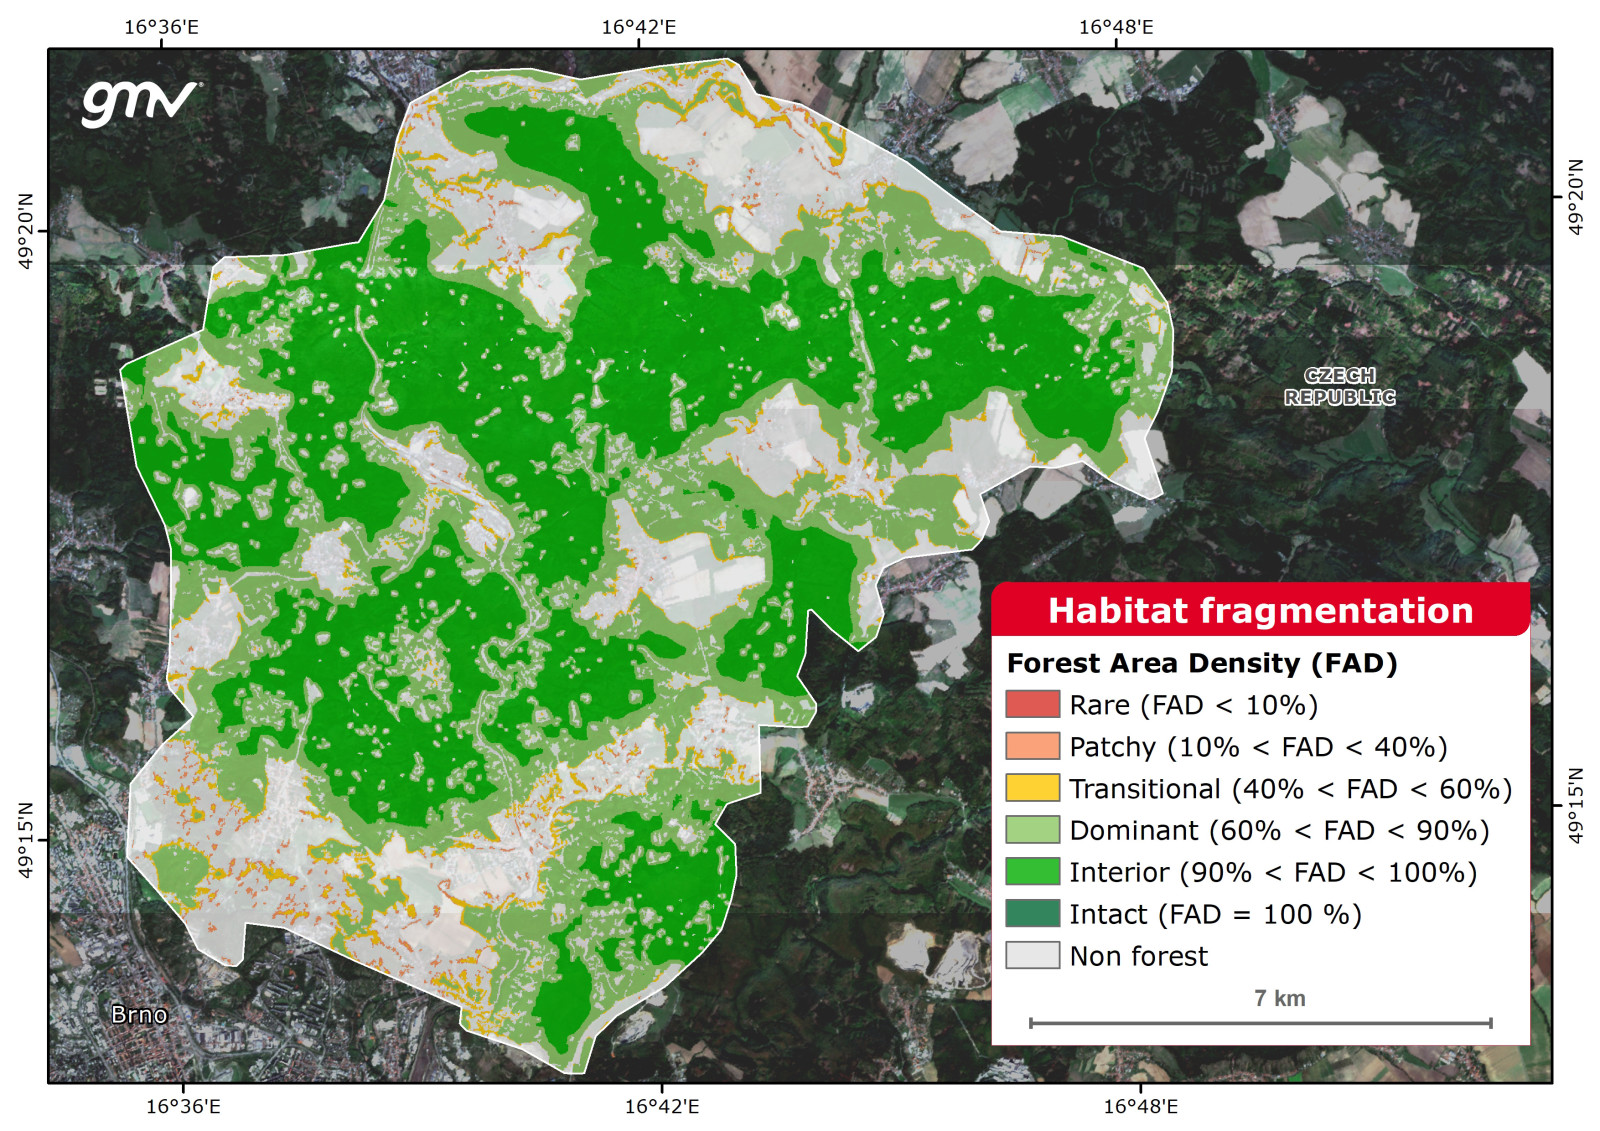
Habitat Fragmentation
Habitat fragmentation maps and monitors the emergence of discontinuities (fragmentation) in the vegetation of a specific habitat. The Habitat Fragmentation product is obtained by classifying spatial patterns of forest patches and evaluating forest densities. Sustainable forest management can be achieved in several ways including by managing forests for ecosystem services (beyond simple provisioning). The Habitat Fragmentation product is obtained by classifying spatial patterns of forest patches and measuring forest area density to quantify forest fragmentation.
Main applications:
- Landscape ecology
- Ecosystem restoration
- Environmental impact assessment


