Mapping climate information to quantify climate hazards
As the impacts of climate change become increasingly apparent, the need for effective climate monitoring has never been more critical. To address this need, RethinkAction conducts a risk analysis of the project case studies using multi-criteria tools. Mapping plays a relevant role in this process, providing a visual representation of the spatial distribution of climate data developed by the project, which helps to understand climate hazards and, consequently, supports the identification of the climate risks for each case study.
A key component of this effort is the use of Essential Climate Variables (ECVs) as a source of high-resolution climate spatial data. The ECVs are a set of 55 physical, chemical or biological variables that contribute to the characterization of Earth's climate. CMCC, one of the RethinkAction partners, has developed five of these ECVs at case study level, using as inputs the coarse grid Couple Model Intercomparison Project Phase 6 (CMIP6) projections under different assumptions (or scenarios), called Shared Socioeconomic Pathways (SSPs), and for the defined four time periods of the project (historical reference period (1985-2014), near-term (2015-2040), mid-term (2041-2070), and long-term (2071-2100)). Subsequently, using these five ECVs, additional twenty-five variables have been derived considering the project requirements.
CMCC has generated thousands of files in both geospatial and tabular formats, with the aim of characterizing the potential evolution of the ECVs at case study level throughout monthly, annual time series, and 30-year average periods. To exploit the results and provide value-added information to the case studies, maps, graphs, and tables have been produced to make the climate data more visual and understandable. All the original ECV datasets are shared through the RethinkAction Zenodo Repository.
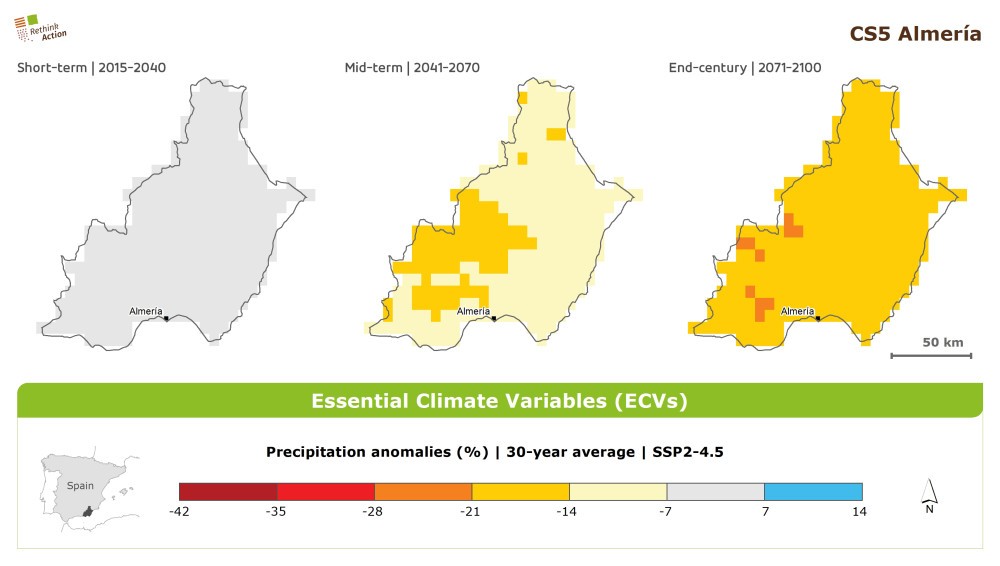
Maps have been developed to support the quantification of climate hazards at local level, with a particular focus on the spatial representation of the anomalies of three basic ECVs: daily maximum near surface air temperature, precipitation and near surface wind speed. These anomaly maps illustrate deviations from long-term average conditions, highlighting areas that could experience significant changes in climate patterns. This is crucial for understanding how and where climate change can affect different regions within the case studies, allowing for targeted and effective responses. Each anomaly map is created using one of the three projected 30-year average periods - short-term, mid-term, and end-century, against the historical reference period for each SSP scenario.
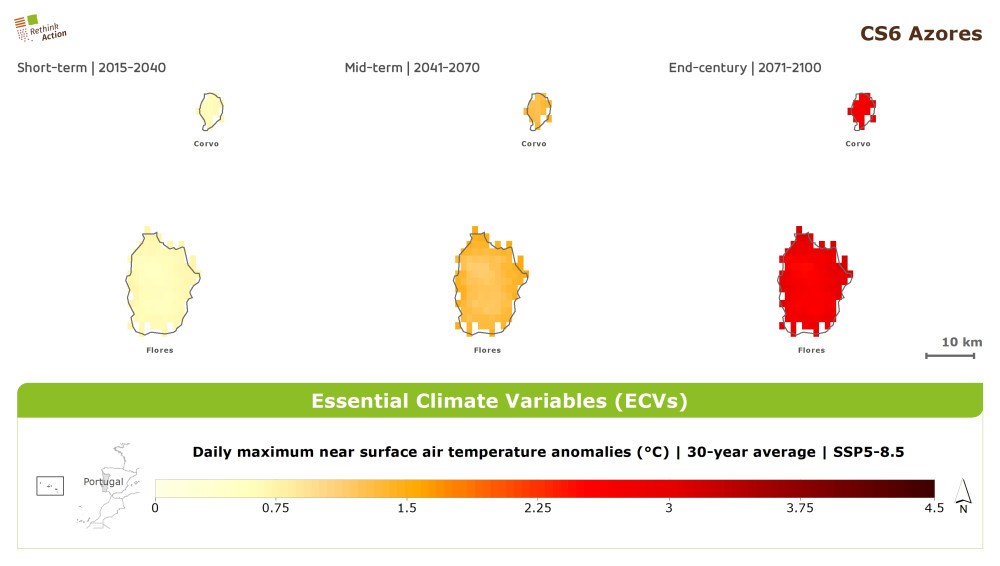
In total, 63 anomaly maps were created for the three selected ECVs for the six case studies and for the three scenarios. Within each map, the anomaly of the represented ECV is included for the three future 30-year average projection periods. The map scale is adapted to each specific variable and case study for cartographic reasons, given the considerable variability among the regions. To ensure an adequate representation of the Azores region case study which contains several islands, the maps of this region were divided in three (West islands group, South group and Central group). Therefore, for each variable of each scenario, three maps are provided for Azores region case study. Please note that near surface wind speed data was unavailable for the Azores case study. Therefore, no maps of this variable were created for this case study.
Maps provide an immediate visual insight into the projected trends, facilitating the identification of critical areas where climate change can be more relevant. This supports the design of action plans and ensures that resources are efficiently allocated in the most affected areas among the regions of interest.
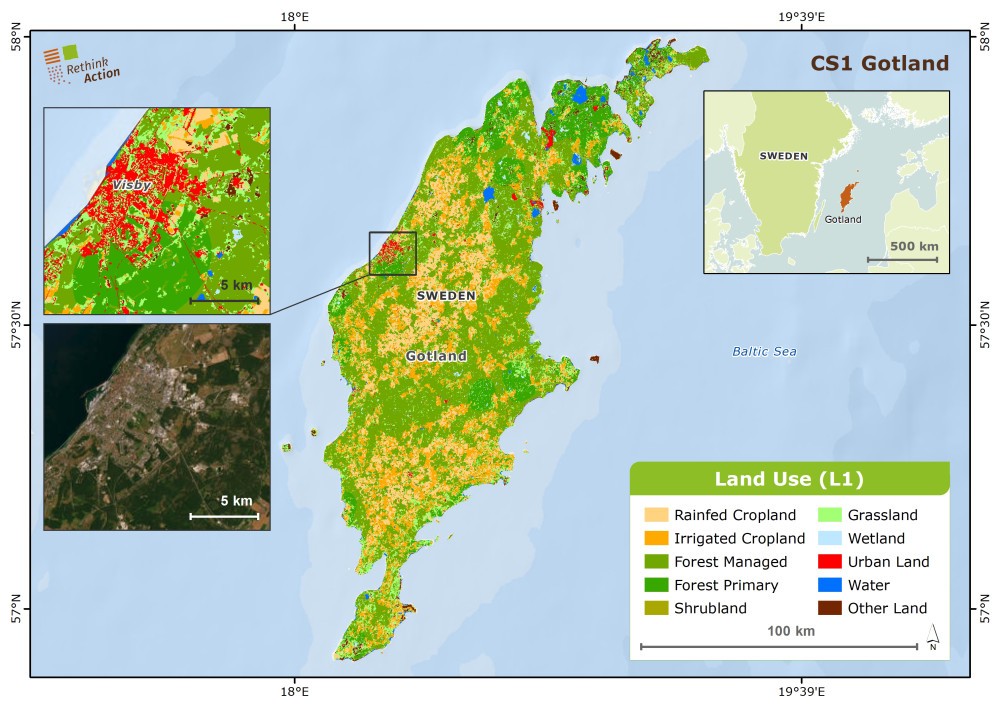
Within the project framework, additional maps have been developed to support the visualization of other products created by RethinkAction. These maps encompass a variety of outputs, including high-resolution land use products and the suitability analysis for each case study. Furthermore, visual communication items have been designed to enhance the understanding and dissemination of climate information. As the project progresses, additional maps will be generated as needed to ensure comprehensive coverage and continuous support for the climate risk assessment and decision-making.
By leveraging advanced mapping techniques and high-resolution climate data, RethinkAction aims to provide invaluable insights into climate hazards and risks. This approach not only facilitates better understanding and preparedness but also empowers stakeholders to take informed actions in mitigating the impacts of climate change.
Authors: Patricia Pérez and Marta Toro (GMV)
This article was first published on rethinkaction.eu.
RethinkAction is funded under the Horizon 2020-EU.3.5 Programme. The project brings together thirteen partners from nine countries, combining various fields of expertise with the aim of developing a cross-sectoral decision-making platform tailored to the needs of different end-users. The platform will deliver clear and valuable information on climate change and increase awareness and attractiveness regarding land use-based mitigation and adaptation solutions.
More information here: RethinkAction Project - home